Six views of one inventory, and a map that never moves

A stable place for every system

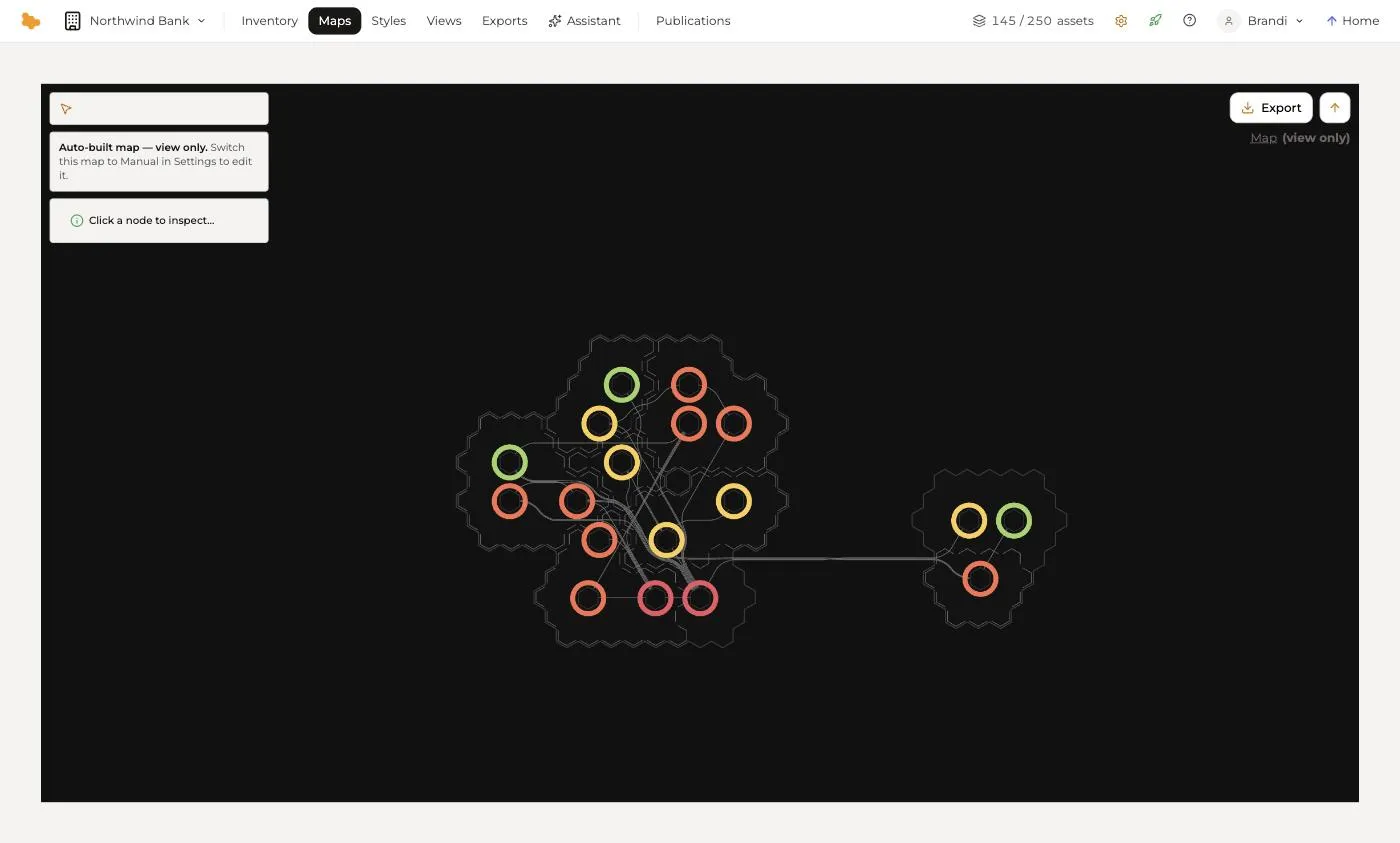
A map gives your estate a geography. Assets are pinned to a grid, grouped into regions, and joined by the roads between them — so the same system is always in the same place, and people learn the landscape the way they learn a city.

That stability is what separates a map from a graph. A graph re-lays itself out every time the data changes; a map keeps its coordinates, so what you learned last month still holds.

A new workspace gets a map built for it from whatever landed in the inventory, and an auto-built map rebuilds itself as the inventory changes. Switch it to manual when you want to place things by hand.

An auto-built software map: applications as coloured rings inside hexagonal regions, joined by the integrations between them.

Software mapping takes key ideas from geographic information systems — a fixed place for everything, zoom levels, layers — and applies them to understanding complex systems of software.

Styles tell the story

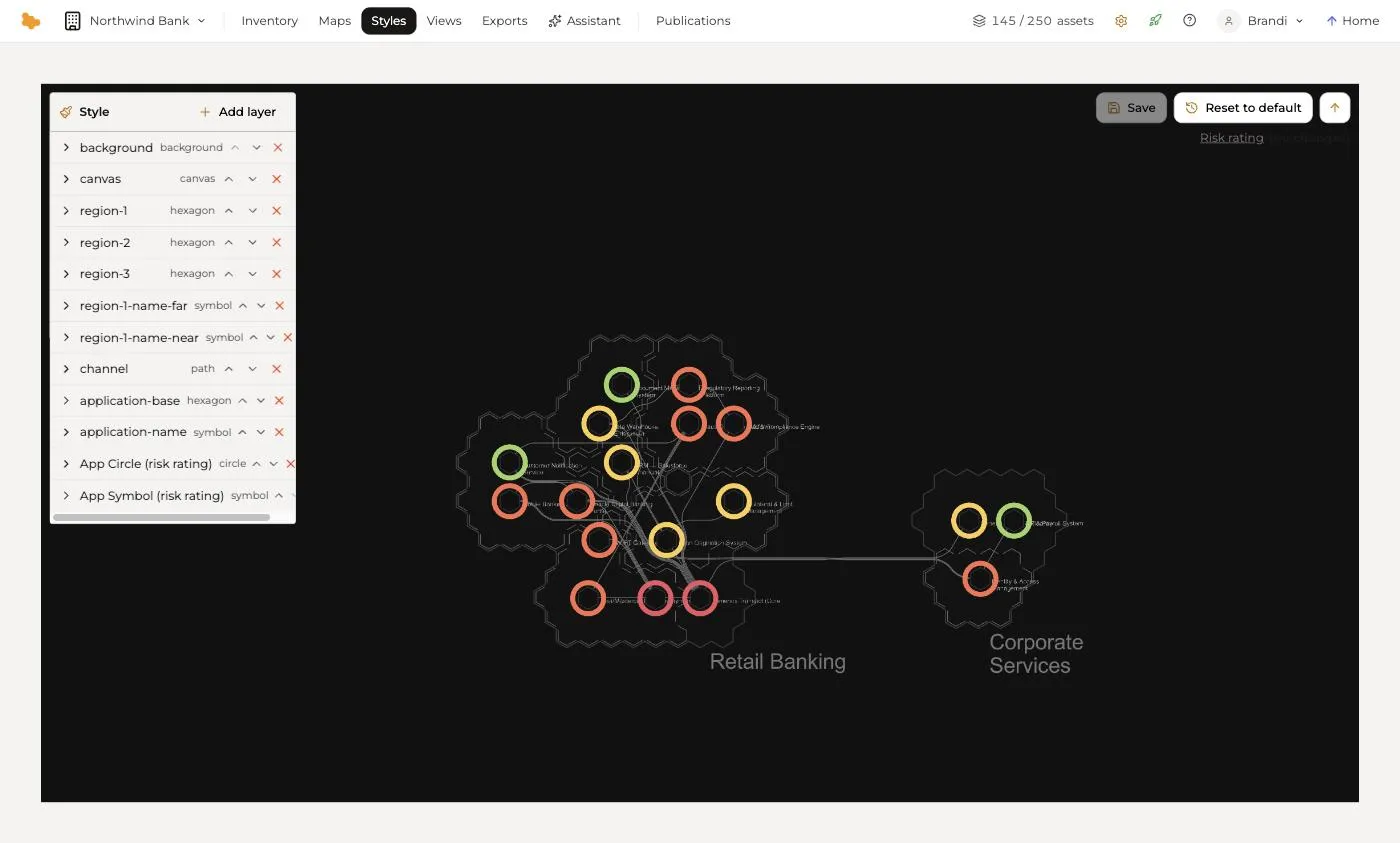
A style decides how a map is coloured and labelled, and a map can carry many. Colour applications by risk rating for the security review, by cost for the budget conversation, by lifecycle for the roadmap — the same geography every time, so the audience never has to relearn where things are.

The style designer works in layers — regions, roads, nodes and labels — coloured by a field, by an option's own colour or by relationship type. Export the result as a PNG, or publish the styled map as a view.

The style designer: a software map on a dark ground, its applications ringed in colour by risk rating, with the style's layers listed beside it.

Tables and matrices

A table is the inventory grid as a view: rows and columns with the same sorting, filtering and column control, saved so the CIO's list and the auditor's list are each one click away. Any table exports to Excel exactly as shown.

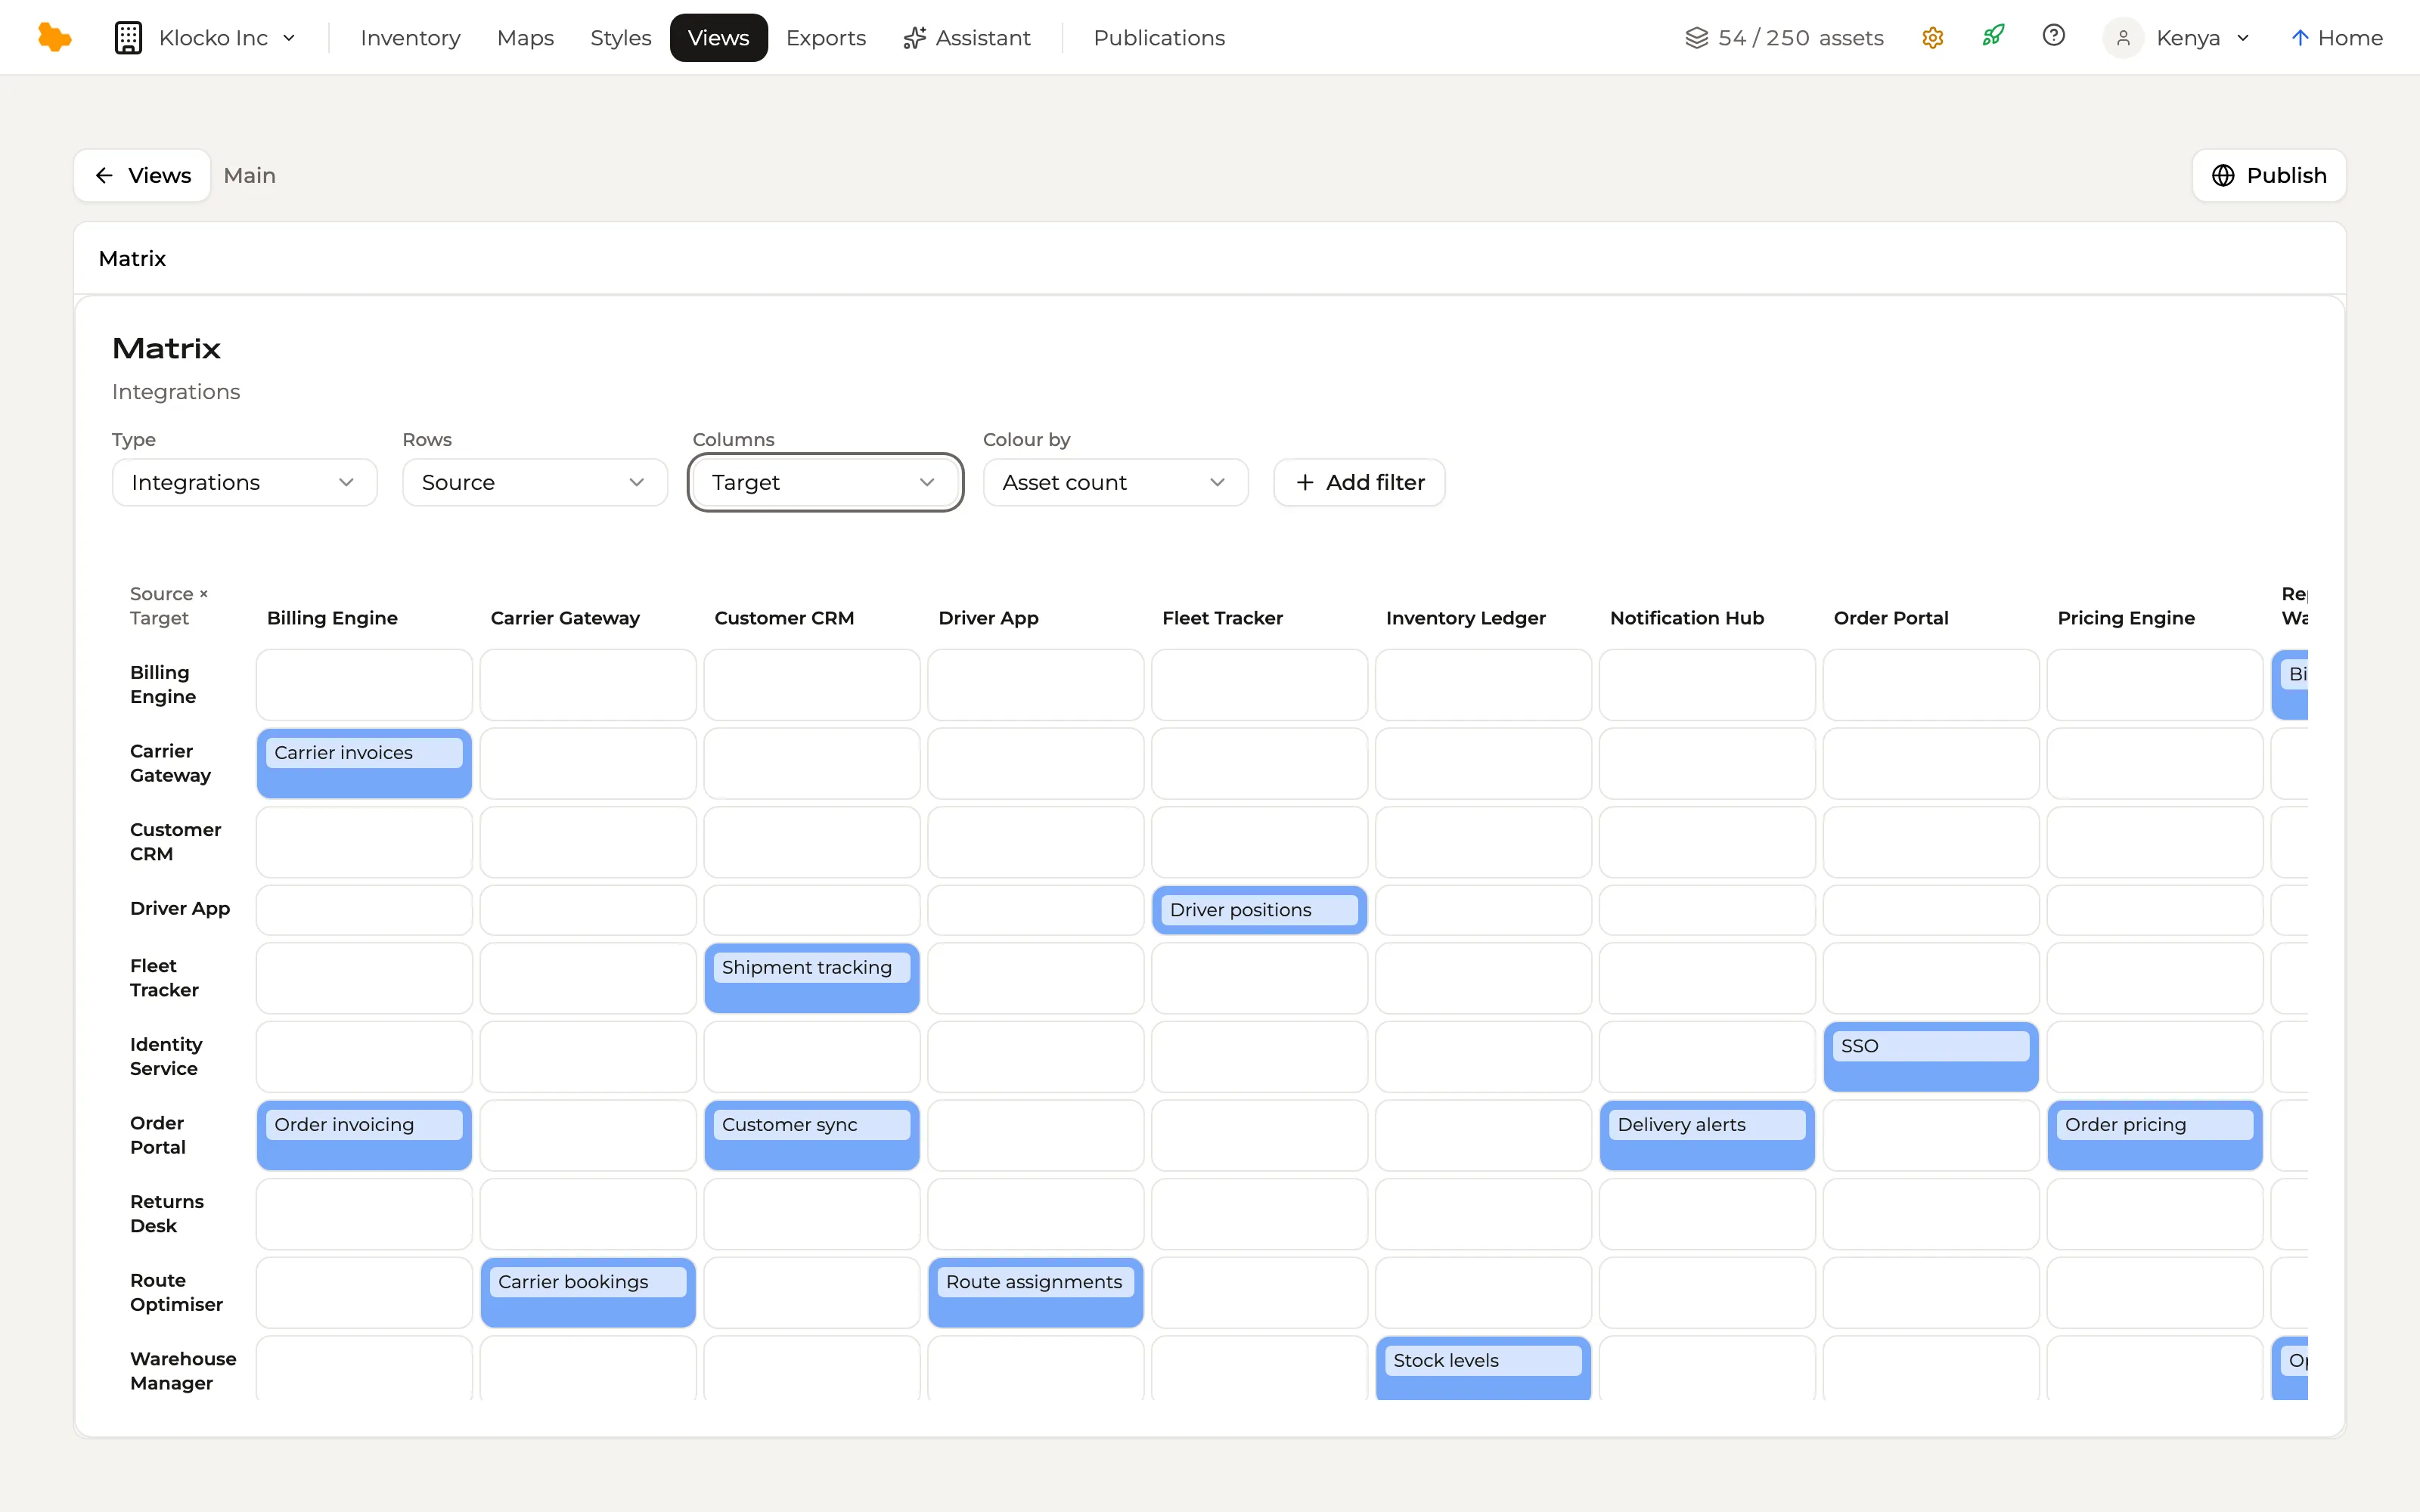
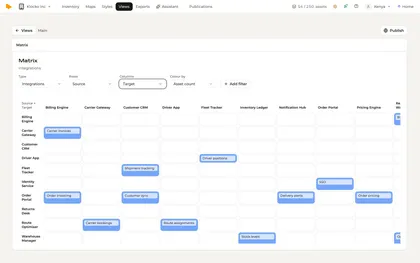
A matrix places assets in cells by two fields — which capabilities are served by which applications, which vendors sit behind which business units — and colours each cell by a third. An empty cell is the gap the matrix exists to find.

A matrix view of integrations, source applications down the side and target applications across the top — Order Portal to Billing Engine, Customer CRM, Notification Hub and Pricing Engine; Fleet Tracker to Customer CRM; Warehouse Manager to Inventory Ledger.

Graphs, Flows and search

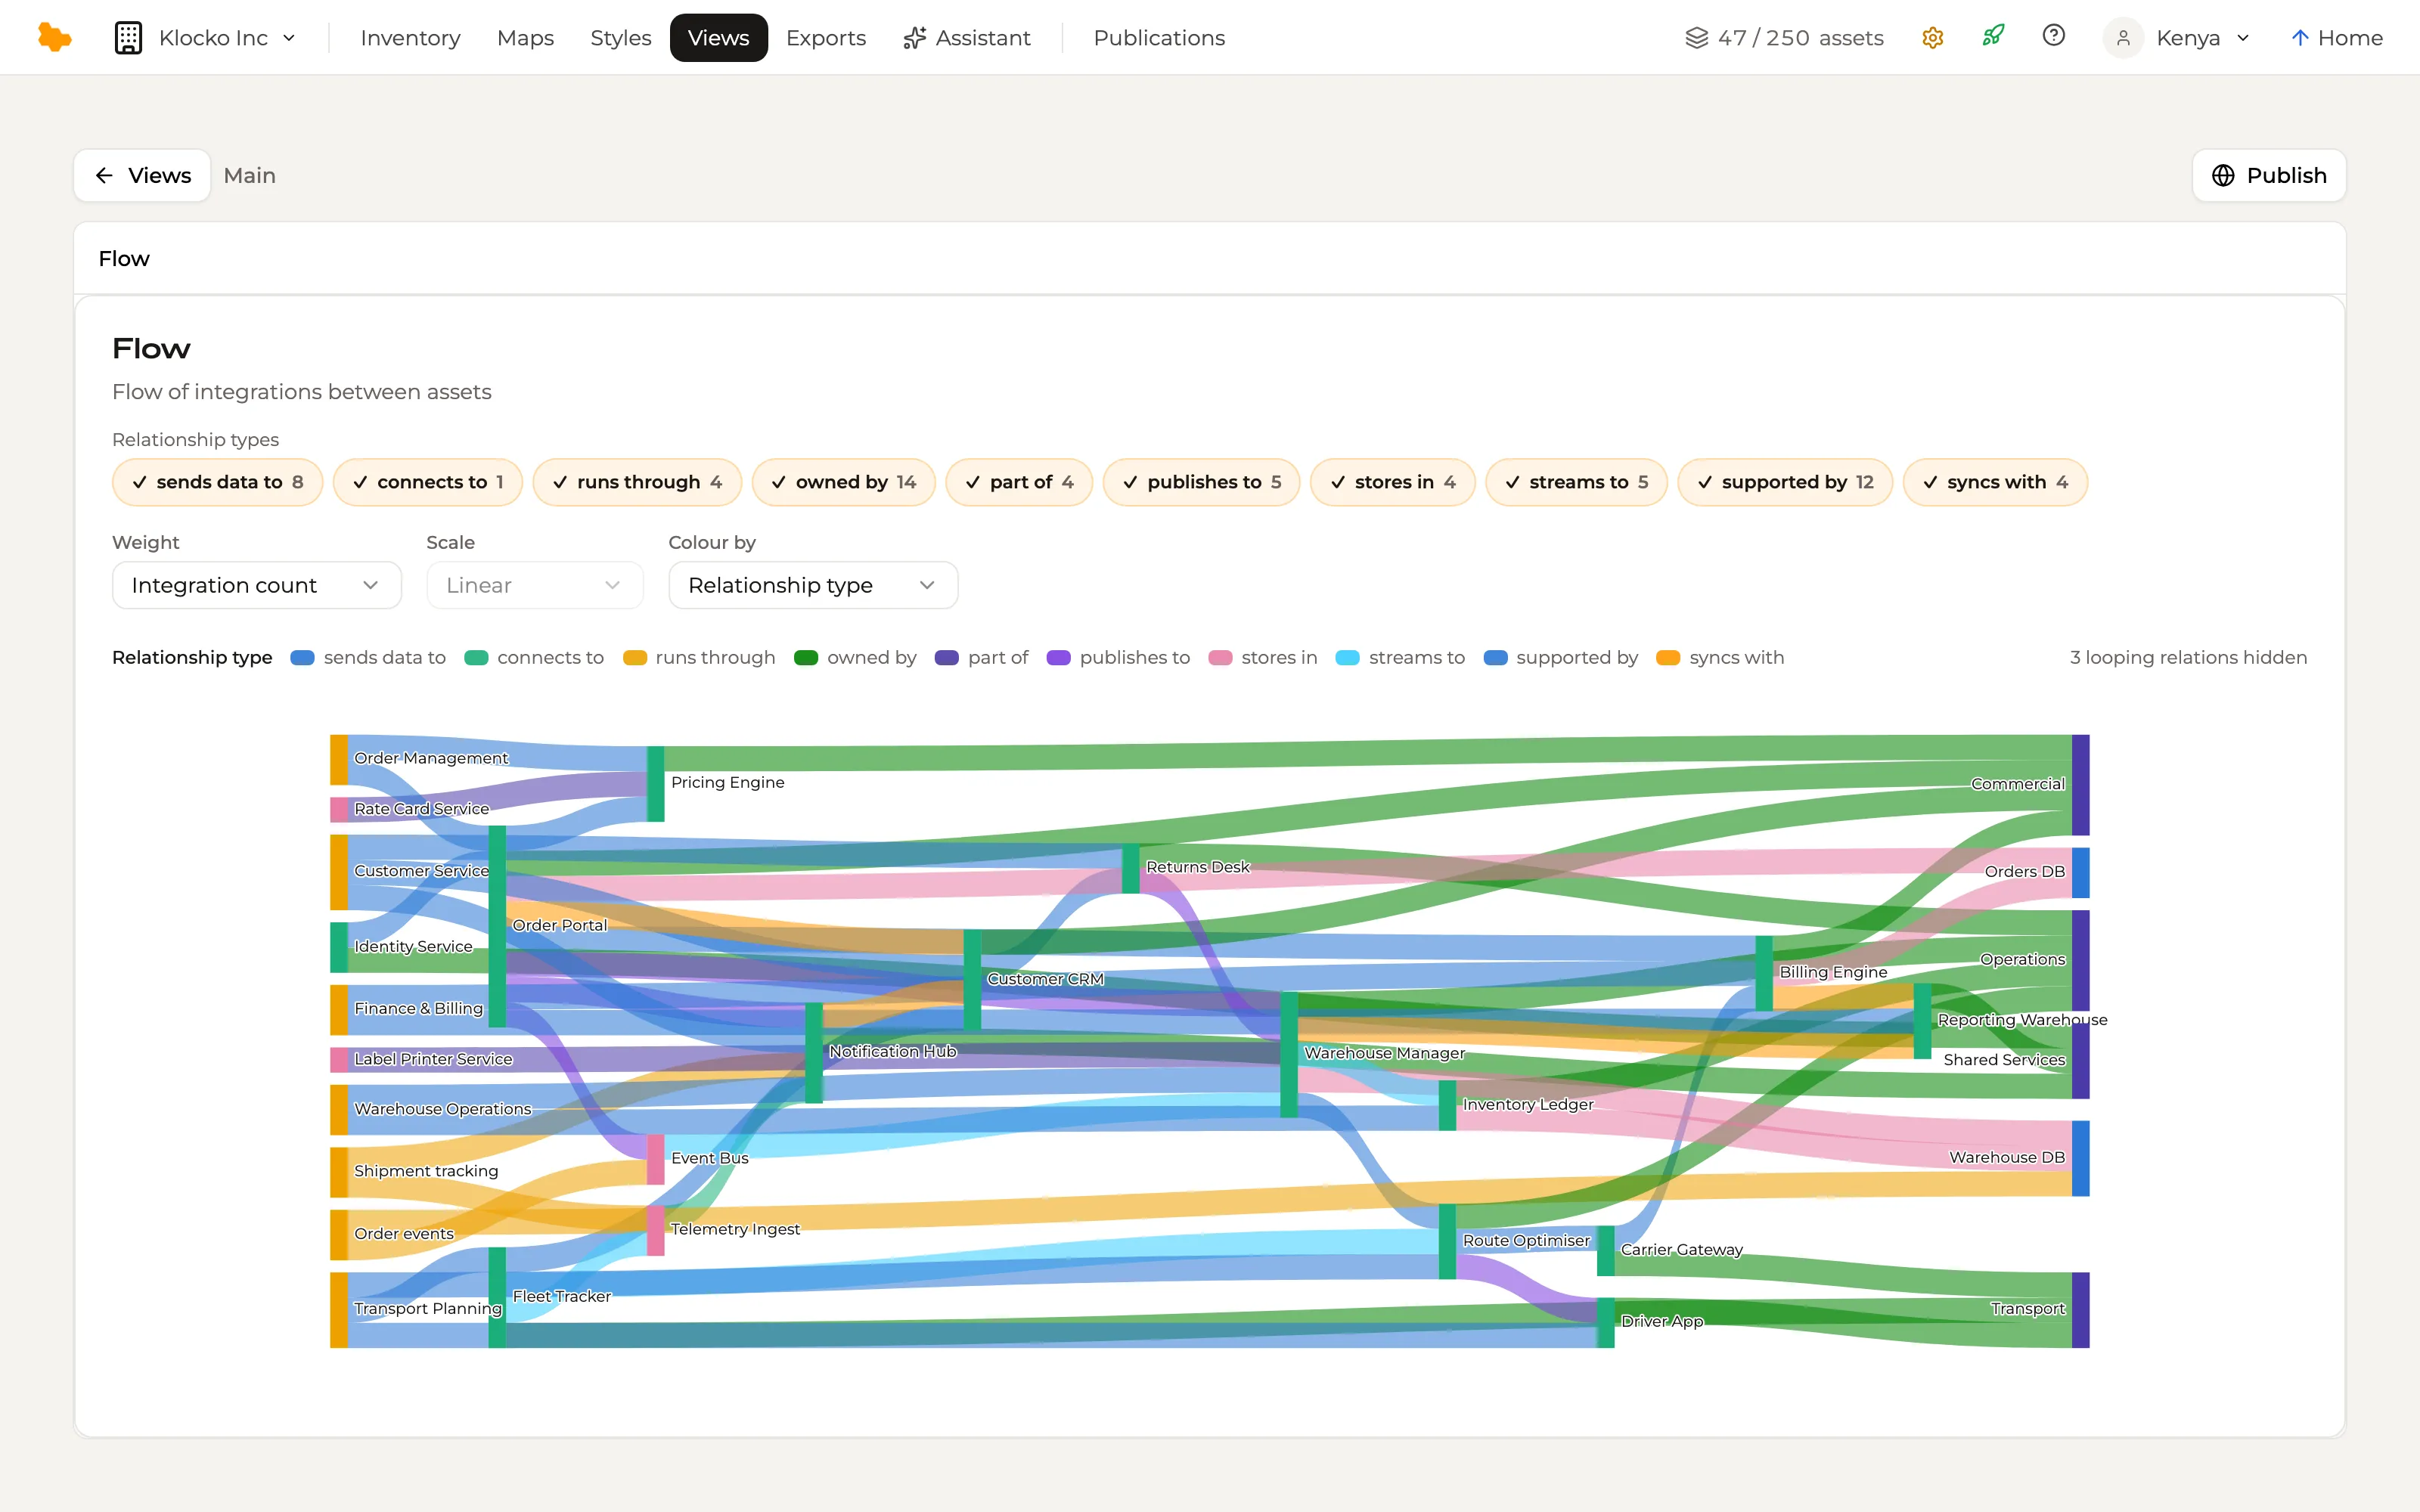
A graph draws assets as nodes and relations as edges, laid out by connection — the shape of the estate's dependencies rather than its geography. A Flow follows the integrations between systems as ribbons between bars, coloured by the field you choose, so you can see what carries the most and where it lands.

Search is a query surface over the whole workspace: every field of every asset type, with facets to narrow it. Publish it and your organization has one place to look something up.

A Flow view: integrations as ribbons between the systems they connect — Order Portal, Customer CRM, Warehouse Manager, Fleet Tracker — each ribbon coloured by its relationship type, with the type filters and legend above.

Views gathers all of them

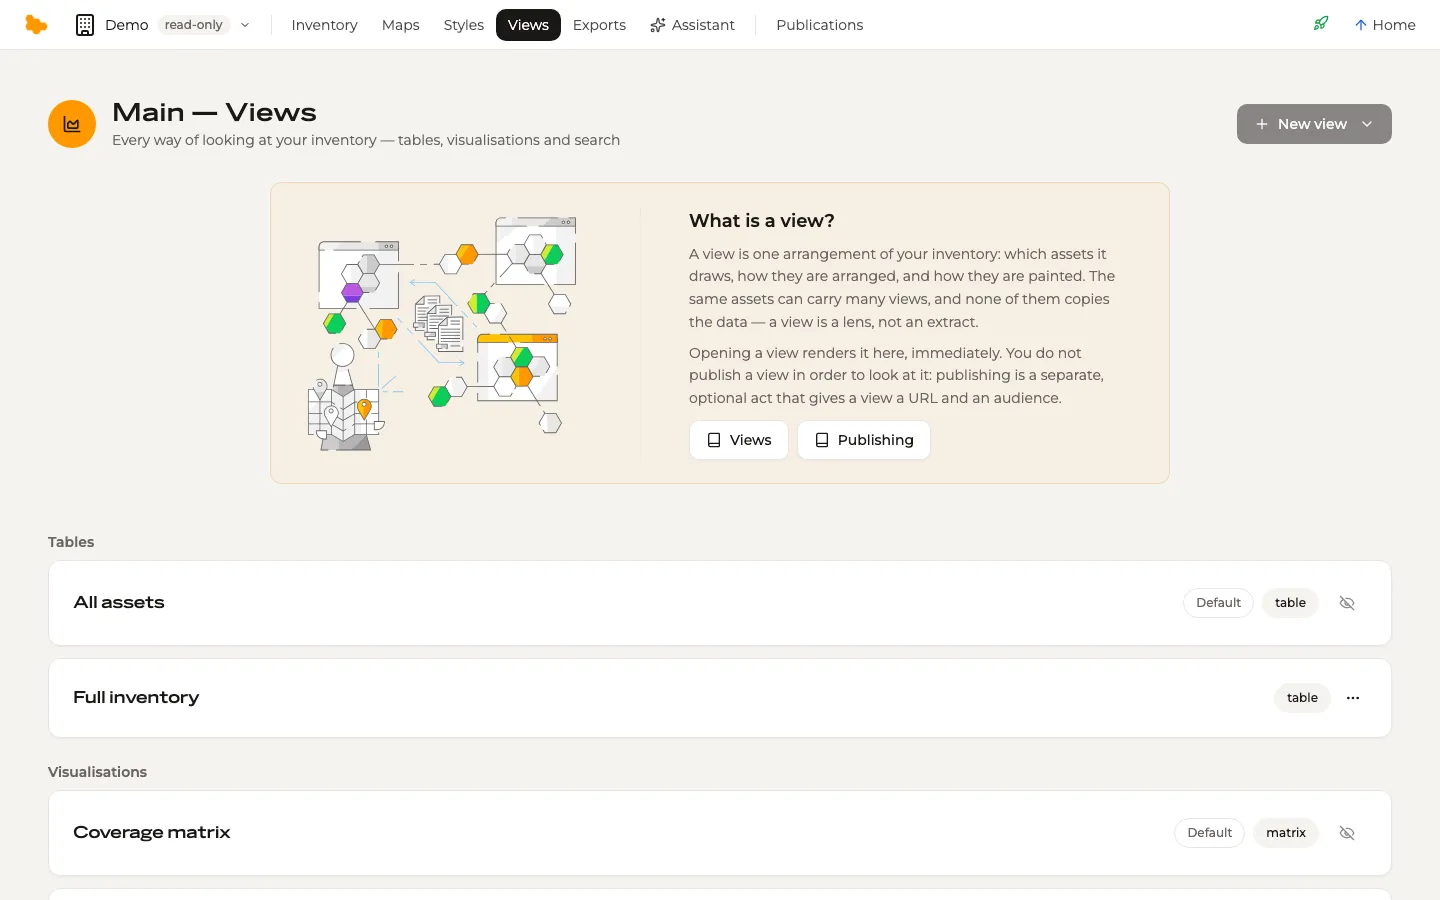
Views is every way of looking at the inventory in one place. A new workspace opens with a default table, matrix, graph and search already there; acting on one makes it yours, and New view creates one of any type.

A view is shared, not personal — change its controls and it changes for everyone who opens it — and a view is a lens, not an extract. It never needs refreshing.

The Views hub of the demo workspace: tables, visualisations and search, with a New view button.

See it in the demo

Map

Application landscape

Every application in the estate, placed on a map and grouped by the business unit that owns it.

A stable place for everything
Assets are pinned to a grid, so the same system is always in the same place. Pan and zoom the way you would a city map.
Regions and roads
Business units draw as regions; integrations draw as the roads between the systems they connect. Click a road to see what runs along it.
Select anything
Click an application to see its fields, its relations and where it sits in the inventory.
Open the demo view

Matrix

Capability coverage

Which business capabilities are served by which applications, and where the gaps are.

Two fields, one grid
Choose the asset type to draw, what forms the rows and the columns, and what colours each cell.
Gaps are visible
An empty cell is a capability with nothing behind it — the question a matrix exists to answer.
Open the demo view

Graph

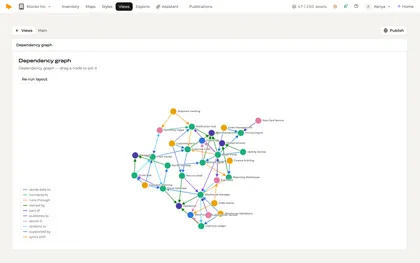
Dependency graph

How the estate hangs together: applications, the APIs between them, and what runs on what.

Laid out by connection
Assets as nodes and their relations as edges, arranged by what connects to what rather than by a fixed position.
Typed relations
Each edge carries its relationship type — depends on, runs on, consumes — and the colour that type is given.
Open the demo view

Five published views of one inventory, open to exploreVisit the showcase