Empowering architects to build consensus and drive their business forward

Simplifying software

An architect holds hundreds of applications, thousands of integrations, and the capabilities, teams and technologies behind them. Aplas puts all of it in one inventory and draws it as a map anyone in the business can read.

Unlike an architecture repository built for architects alone, the map is designed to reach the broadest possible audience — so the people you need to persuade can see what you see.

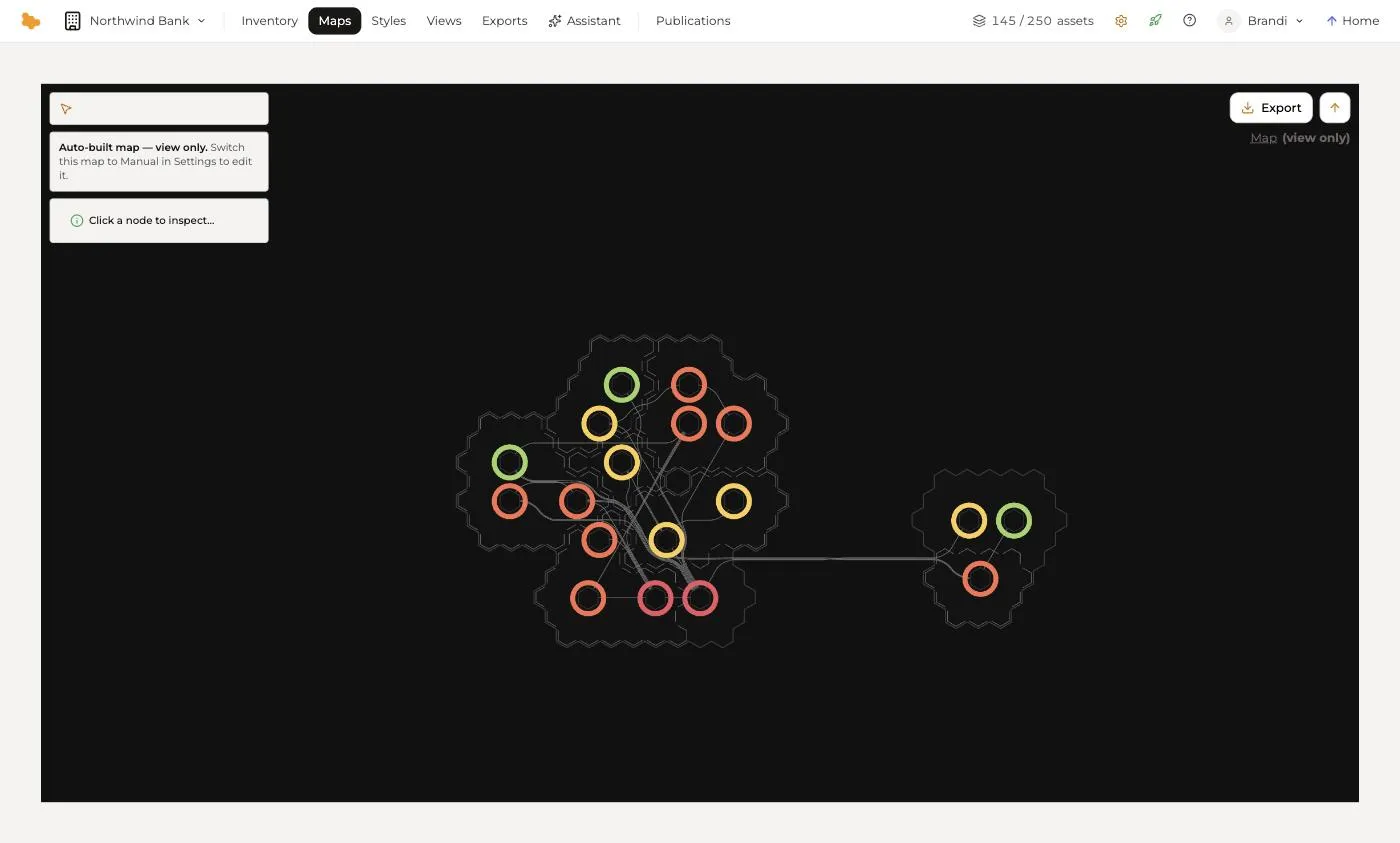
An auto-built software map: applications as coloured rings inside hexagonal regions, joined by the integrations between them.

REA Group

The Challenge

REA Group was one of the earliest adopters of agile methodology and microservices architecture. Over the past decade this has lead to a highly complex architecture, managed by a highly distributed and autonomous workforce, a compounding challenge that makes delivery of end-to-end solutions difficult.

The Result

Introduced in 2018, Aplas is the central repository for software asset metadata within REA Group - across all Australian and Asian businesses. It is used as a key productivity tool to inform the executive and developers alike. It has allowed REA Group to stay agile while continuing to scale.

"Aplas is REA's key product to make sense of our microservices web. As the number of systems, integrations, teams and products increased our ability to understand our ecosystem decreased.With Aplas we now can visualize our digital ecosystem allowing us to make better decisions and effectively manage technology evolution.Aplas has a flexibility that perfectly accommodates our metadata, allowing systems plotted on the map to carry valuable information. This information is used by delivery, business and product people alike."
Dan AragioHead of Architecture
The inventory grid for Applications: columns for status, map size, risk rating and business criticality, with the asset-type rail and facets beside it.

Your data, without the schema project

ITSM, CMDB, EA, PM and source-control tools all hold overlapping, unsynchronised metadata about the same systems. Hand an architect a blank canvas and the first month goes on designing a schema instead of understanding the estate.

Aplas does both halves. The inventory is flexible underneath — asset types, fields and relations are yours to define — and opinionated on top: export from whichever tool you trust most, and the AI proposes a model from the data itself, for you to confirm. Keep it current by hand, over the REST API, or in conversation with the assistant.

How the inventory works

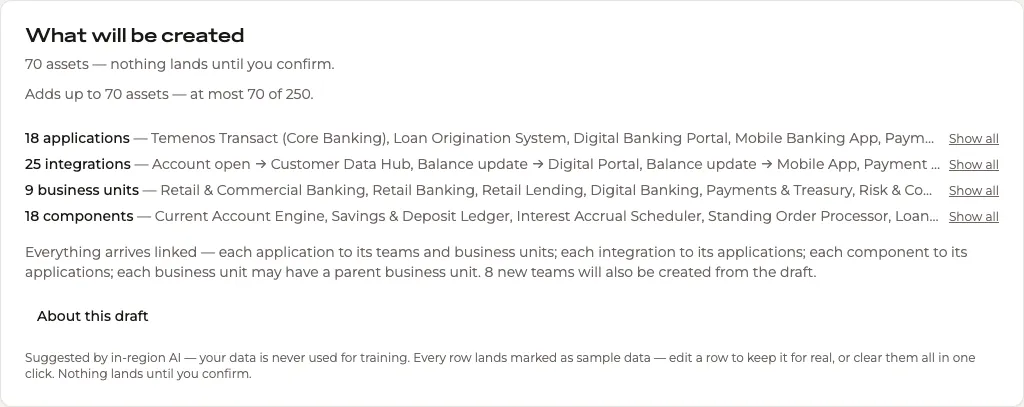
What will be created: a count per asset type, each expandable, above a statement of how the assets will be linked.

Aplas lives at the intersection of people and software - it is the foundation for making better decisions with software, empowering business to thrive in a digital world

Styles tell stories

From a single map, many styles can be designed — each telling a different story on the same geography. Colour applications by risk to show the security review where to look, by lifecycle to show the roadmap what is leaving, by relationship type to show which technology carries which integration.

The style designer is yours: layers, colours and labels driven by any field in the inventory. The map keeps its coordinates, so every story is told on ground the audience already knows.

How views and maps work

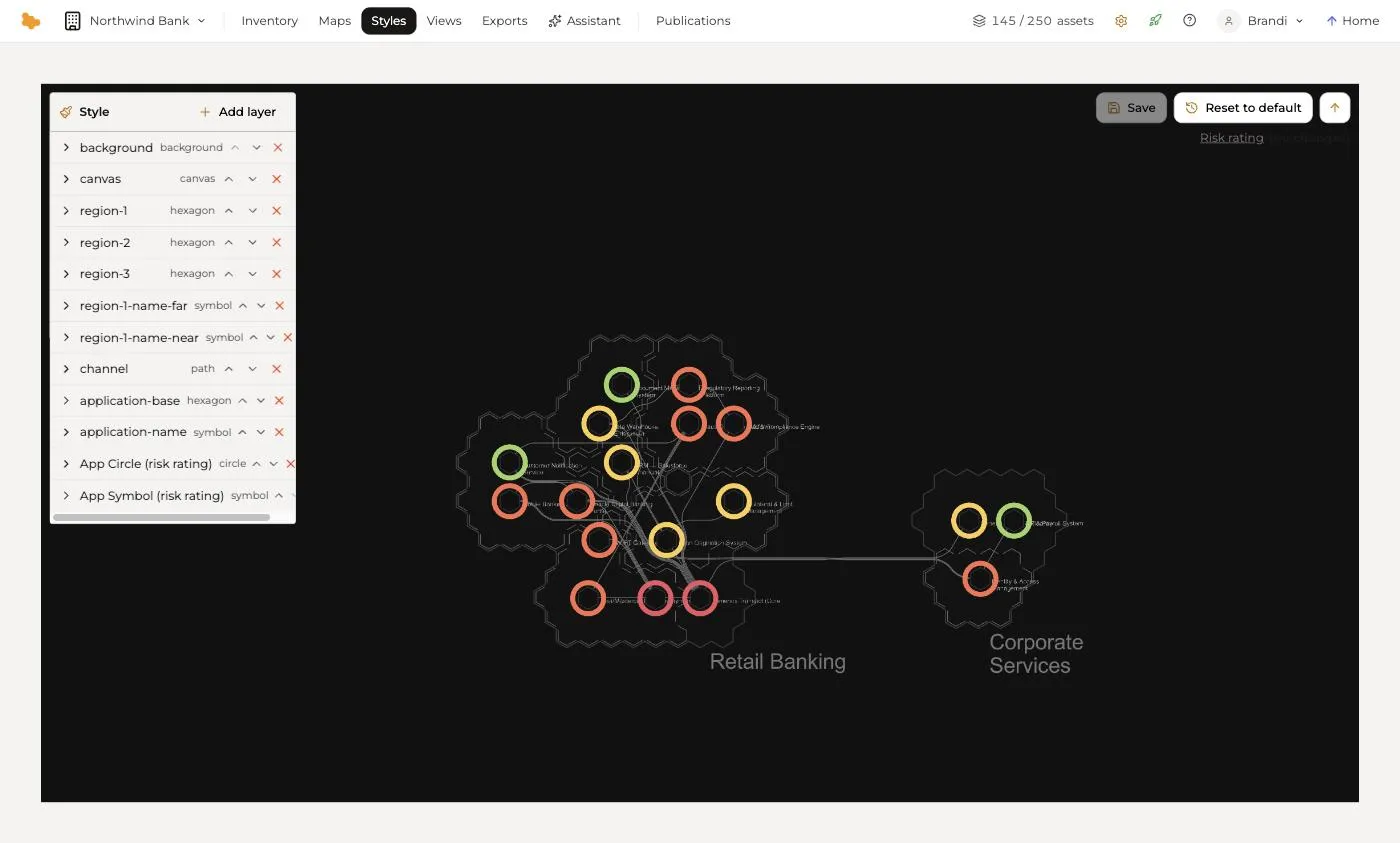
The style designer: a software map on a dark ground, its applications ringed in colour by risk rating, with the style's layers listed beside it.

See it in the demo

Map

Application landscape

Every application in the estate, placed on a map and grouped by the business unit that owns it.

A stable place for everything
Assets are pinned to a grid, so the same system is always in the same place. Pan and zoom the way you would a city map.
Regions and roads
Business units draw as regions; integrations draw as the roads between the systems they connect. Click a road to see what runs along it.
Select anything
Click an application to see its fields, its relations and where it sits in the inventory.
Open the demo view

Graph

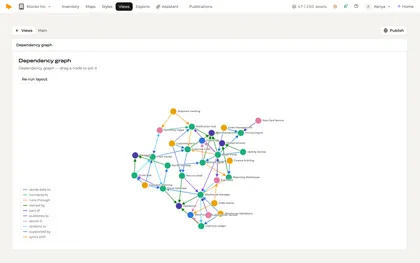
Dependency graph

How the estate hangs together: applications, the APIs between them, and what runs on what.

Laid out by connection
Assets as nodes and their relations as edges, arranged by what connects to what rather than by a fixed position.
Typed relations
Each edge carries its relationship type — depends on, runs on, consumes — and the colour that type is given.
Open the demo view

More of the demo in our showcaseVisit the showcase

Publications empower everyone

Getting the right information to the right people at the right time is the hard part of architecture. When a process fails, who has the picture to make the correction?

Publish any view — the map, the capability matrix, the dependency graph, the table — to your organization's members, and it stays in sync with the inventory. The answer is at a URL, not in a deck that was current last quarter.

How publishing works

Aplas for all

Many existing software asset repositories are so specialised to one audience that they become useless for everyone else. All the effort taken to populate their complex data models ends up being their undoing: they never have enough users to sustain the investment in keeping them up to date.

Aplas is a simple, workflow-agnostic, outward-facing platform that gives everyone a place to learn about software. See how Aplas serves the rest of your organization.

Management