Publish a view to the people who need it

Publish is on every view

You do not publish something in order to look at it — every view renders in the studio the moment you open it. Publishing is the separate, optional act of letting other people see it.

The publish card asks for two things. A URL under your organization — aplas.com/your-org/capability-coverage — with a slug you choose and can change later. And an audience: your organization's members, narrowed to named users where you want it narrower. People sign in to open it.

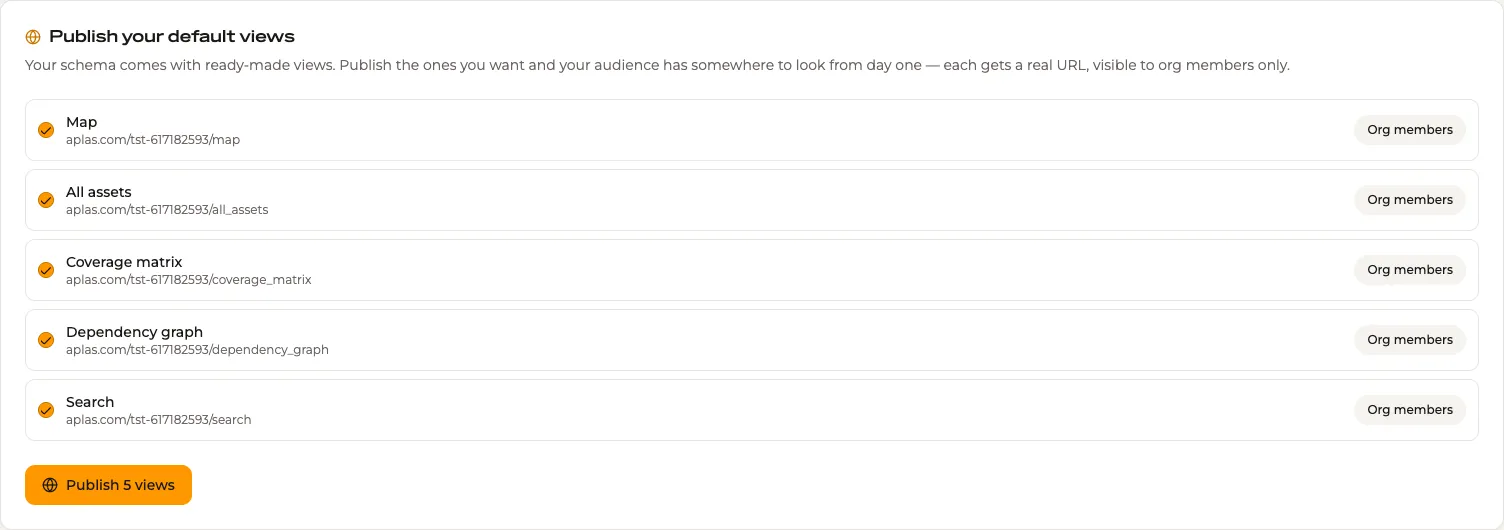
A new workspace comes with ready-made views. Publish the ones you want and your audience has somewhere to look from day one.

Publish your default views: a map, a table, a matrix, a graph and a search, each with its URL and an Org members audience.

What a reader gets

A published view is read-only. Readers explore it — search it, move around it, open an asset to see its detail — and nothing they do writes back to your inventory. That is enforced on our side, not merely hidden in the interface.

It stays in sync with the inventory and updates without a reload, works on a phone, and keeps the style it was published with — changing a style in the studio never moves a live URL underneath its audience. When you want readers to see the new version, republish.

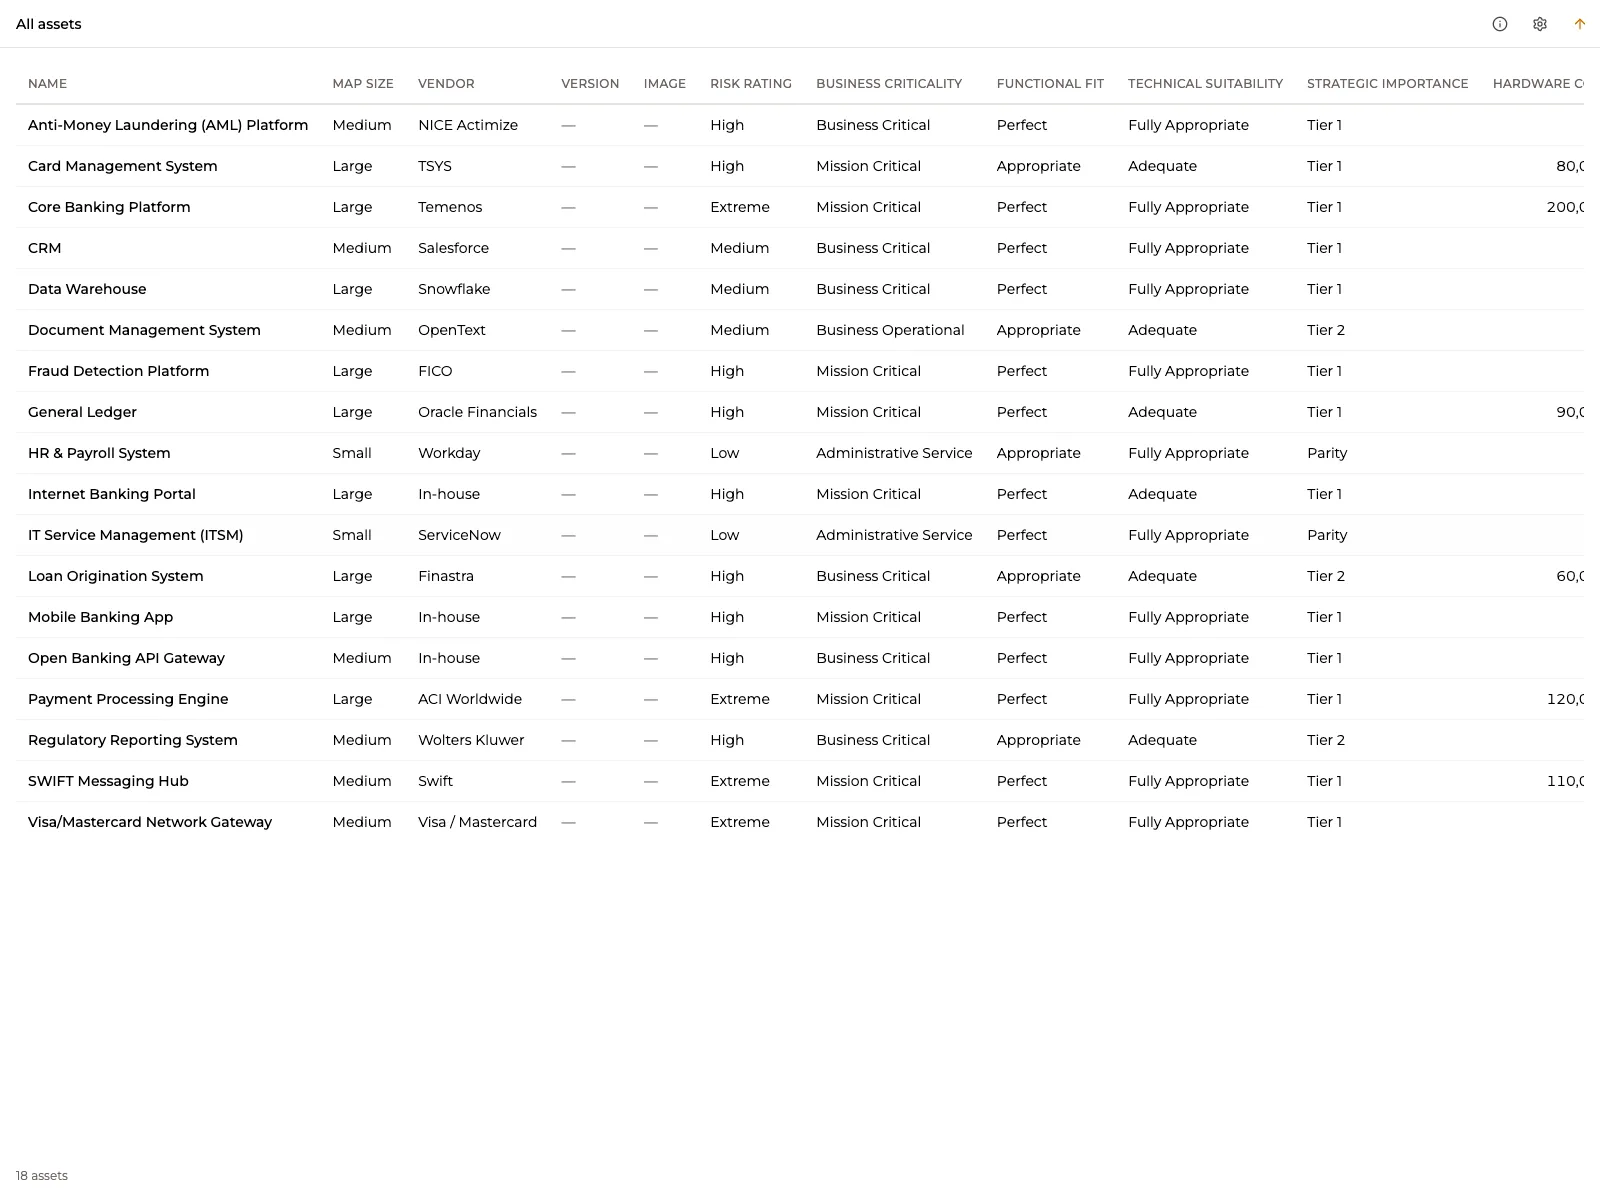
A published table view, All assets: eighteen applications with their map size, vendor, risk rating, business criticality and strategic importance.

Publications: what is live

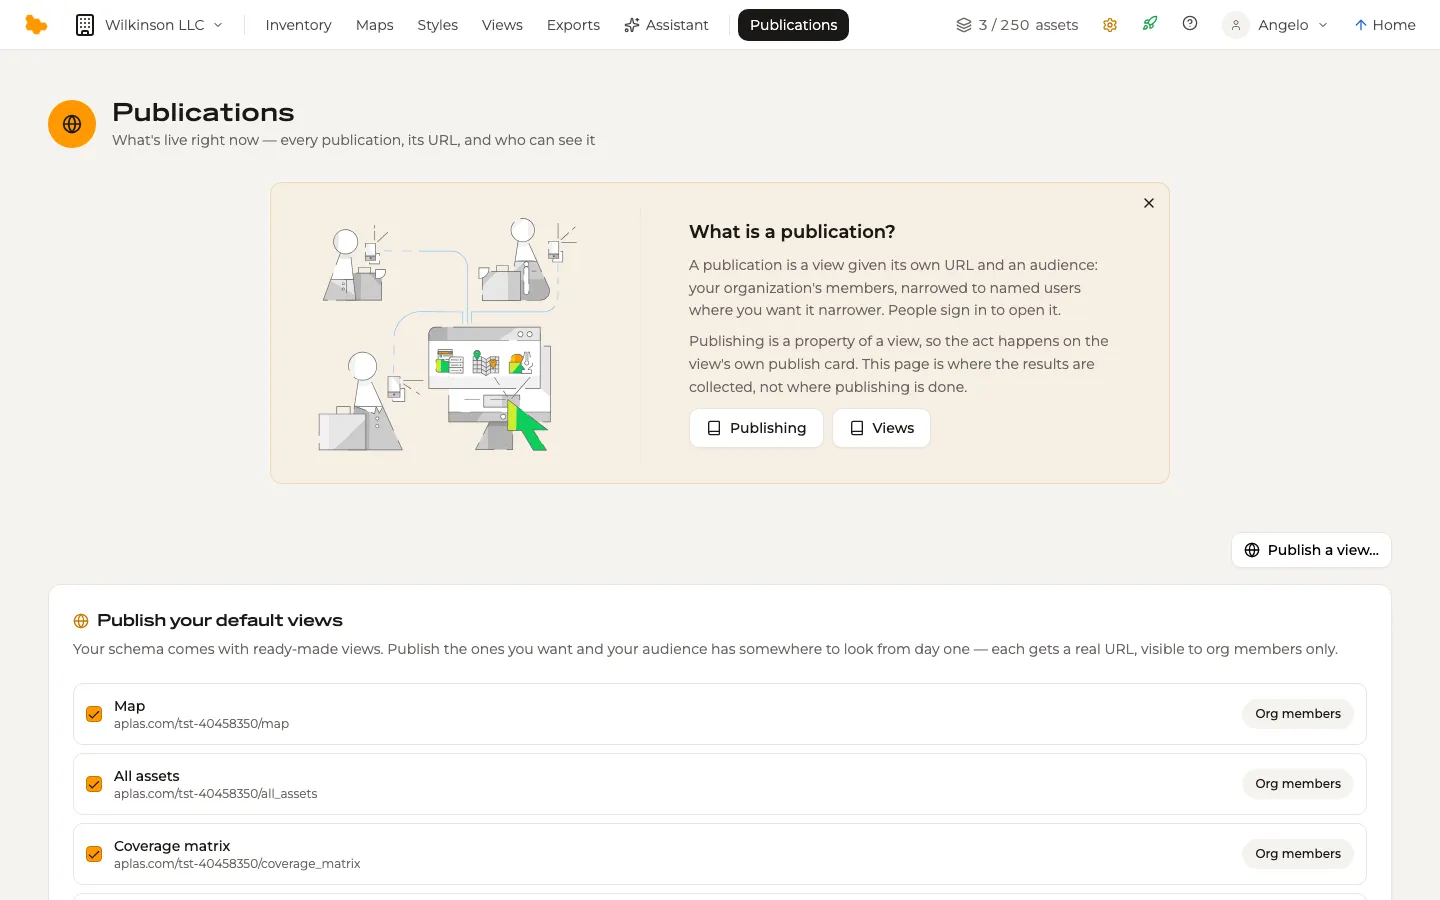
Publications is the registry of everything live across the organization — each view, its URL, and who can see it. Disable a publication to take it down without losing its address; archive it when it is done.

Your organization's home page lists its publications for the people who open it, so a reader who knows only aplas.com/your-org finds the map, the table and the search from there.

The Publications page: what is live right now — every publication, its URL, and who can see it.

Take it with you

Any table view exports to Excel exactly as shown — rows, columns, filters and sort. A State of the Estate PDF reports on the whole inventory. A map exports as a PNG for the slide it is going into.

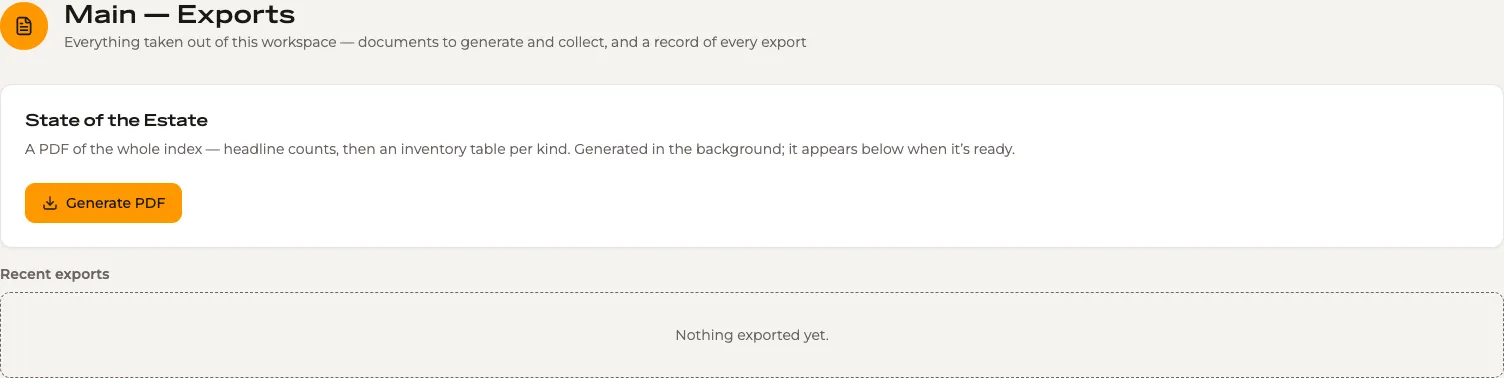
Exports is the organization-wide ledger of every file generated or downloaded, so a report that went to the board can be found again.

The Exports page: the files generated for the workspace, with the State of the Estate report among them.

See it in the demo

Map

Application landscape

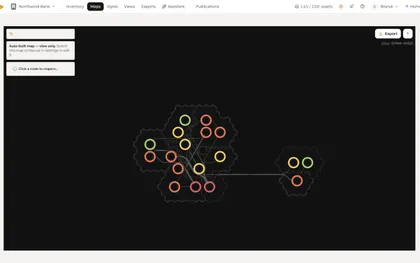
Every application in the estate, placed on a map and grouped by the business unit that owns it.

A stable place for everything
Assets are pinned to a grid, so the same system is always in the same place. Pan and zoom the way you would a city map.
Regions and roads
Business units draw as regions; integrations draw as the roads between the systems they connect. Click a road to see what runs along it.
Select anything
Click an application to see its fields, its relations and where it sits in the inventory.
Open the demo view

Table

Full inventory

The whole catalogue as a sortable, filterable table — every asset type in one place.

The grid, published
The same sorting, filtering and column control as the studio's inventory grid, read-only for its audience.
Export as shown
In the studio, any table view exports to Excel exactly as it appears — rows, columns, filters and sort.
Open the demo view

Search

Search the catalogue

Free-text search across every asset, with facets for type, owner and location.

Find, then follow
Type a name, a vendor or a team and open the asset — its fields, its relations and its recent changes.
Every field is searchable
Built-in and custom fields alike, across every asset type in the workspace.
Open the demo view

Five published views of one inventory, open to exploreVisit the showcase