One inventory of your estate, every way you need to see it
From a spreadsheet to a published map
Aplas separates what you know about your estate from how it is consumed. The inventory is entered once — by hand, from a file, or in conversation — and every view, map and publication reads from it. Change an asset and the map, the table and the publications your organization is reading all update.
- Bring your dataA spreadsheet, a paste, or a description.
- The AI models itAsset types, fields, relations and assets, proposed for you to confirm.
- Look at itA table, a matrix, a graph, a Flow, a map or a search.
- Publish itA URL and an audience for any view, kept in sync.
Inventory
The inventory holds everything you catalogue: assets, grouped into asset types you define, each with its own fields and relations. Applications, integrations, components, business capabilities, teams, data stores and vendors arrive as ready-made types; add your own when nothing offered fits.
Bring a CSV or Excel workbook, or paste from a spreadsheet, and the AI proposes how it becomes assets. You check the proposal and confirm it — nothing is written before that.

Views and maps
The same assets render as a table, a matrix, a graph, a Flow, a map or a search. A view is a lens on the inventory, not a copy of it, so every view is current the moment the data changes.
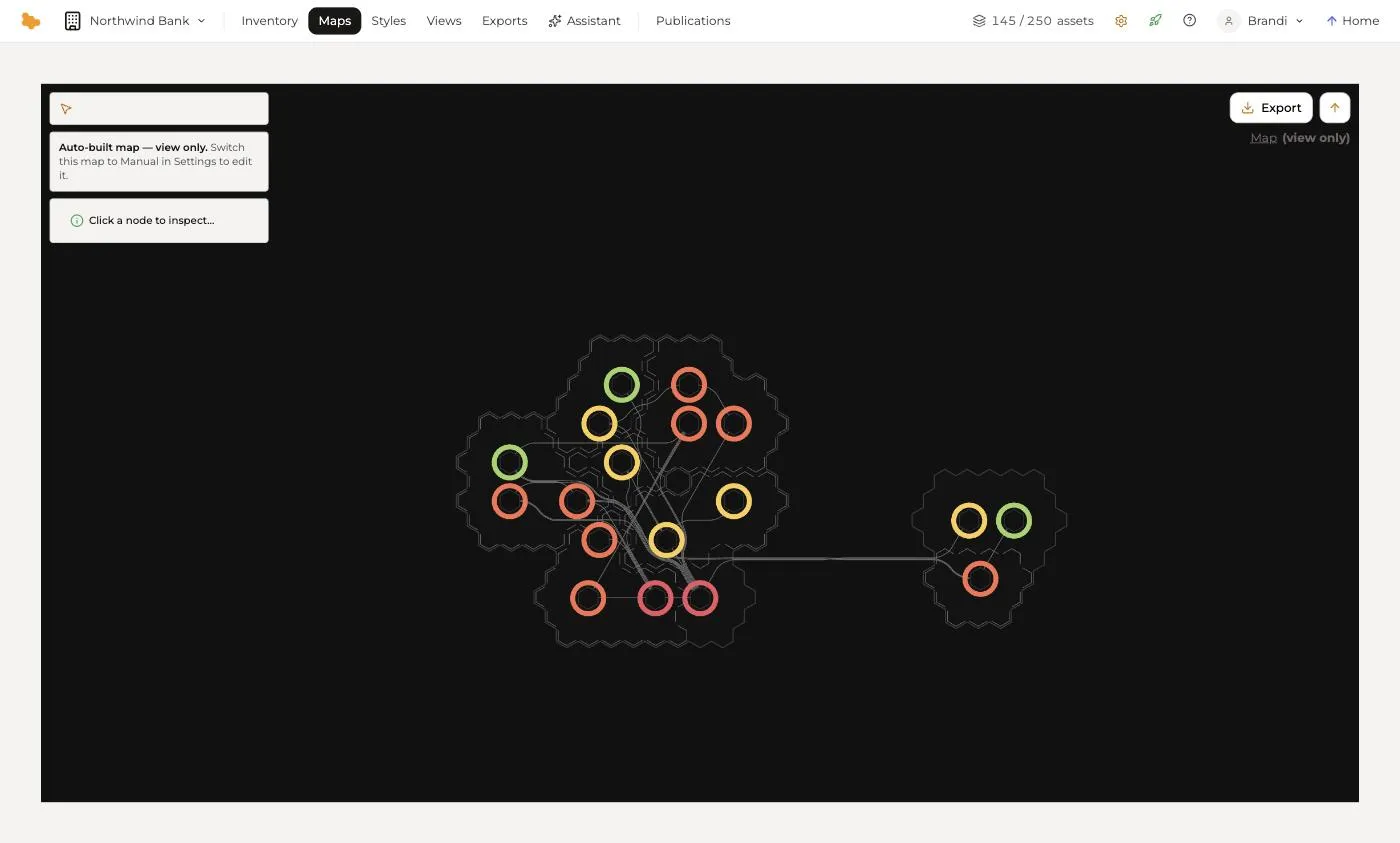
The map is the signature: assets pinned to a stable grid, grouped into regions and joined by the roads between them. A map can carry several styles, each answering a different question on the same geography.
Publish
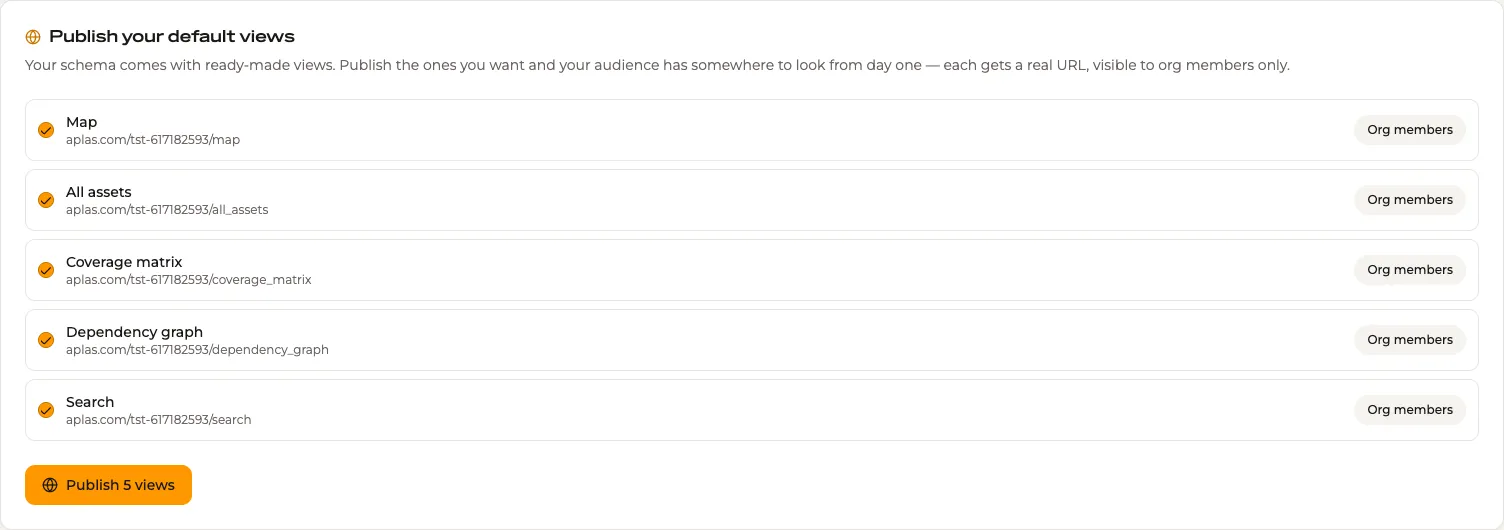
Publishing is an act on a view. Give it a URL under your organization and an audience — your organization's members, narrowed to named users where you want it narrower — and it is live, in sync with the inventory, and readable on a phone.
Publications lists everything that is live across the organization: each view, its URL, and who can see it.
Assistant and API
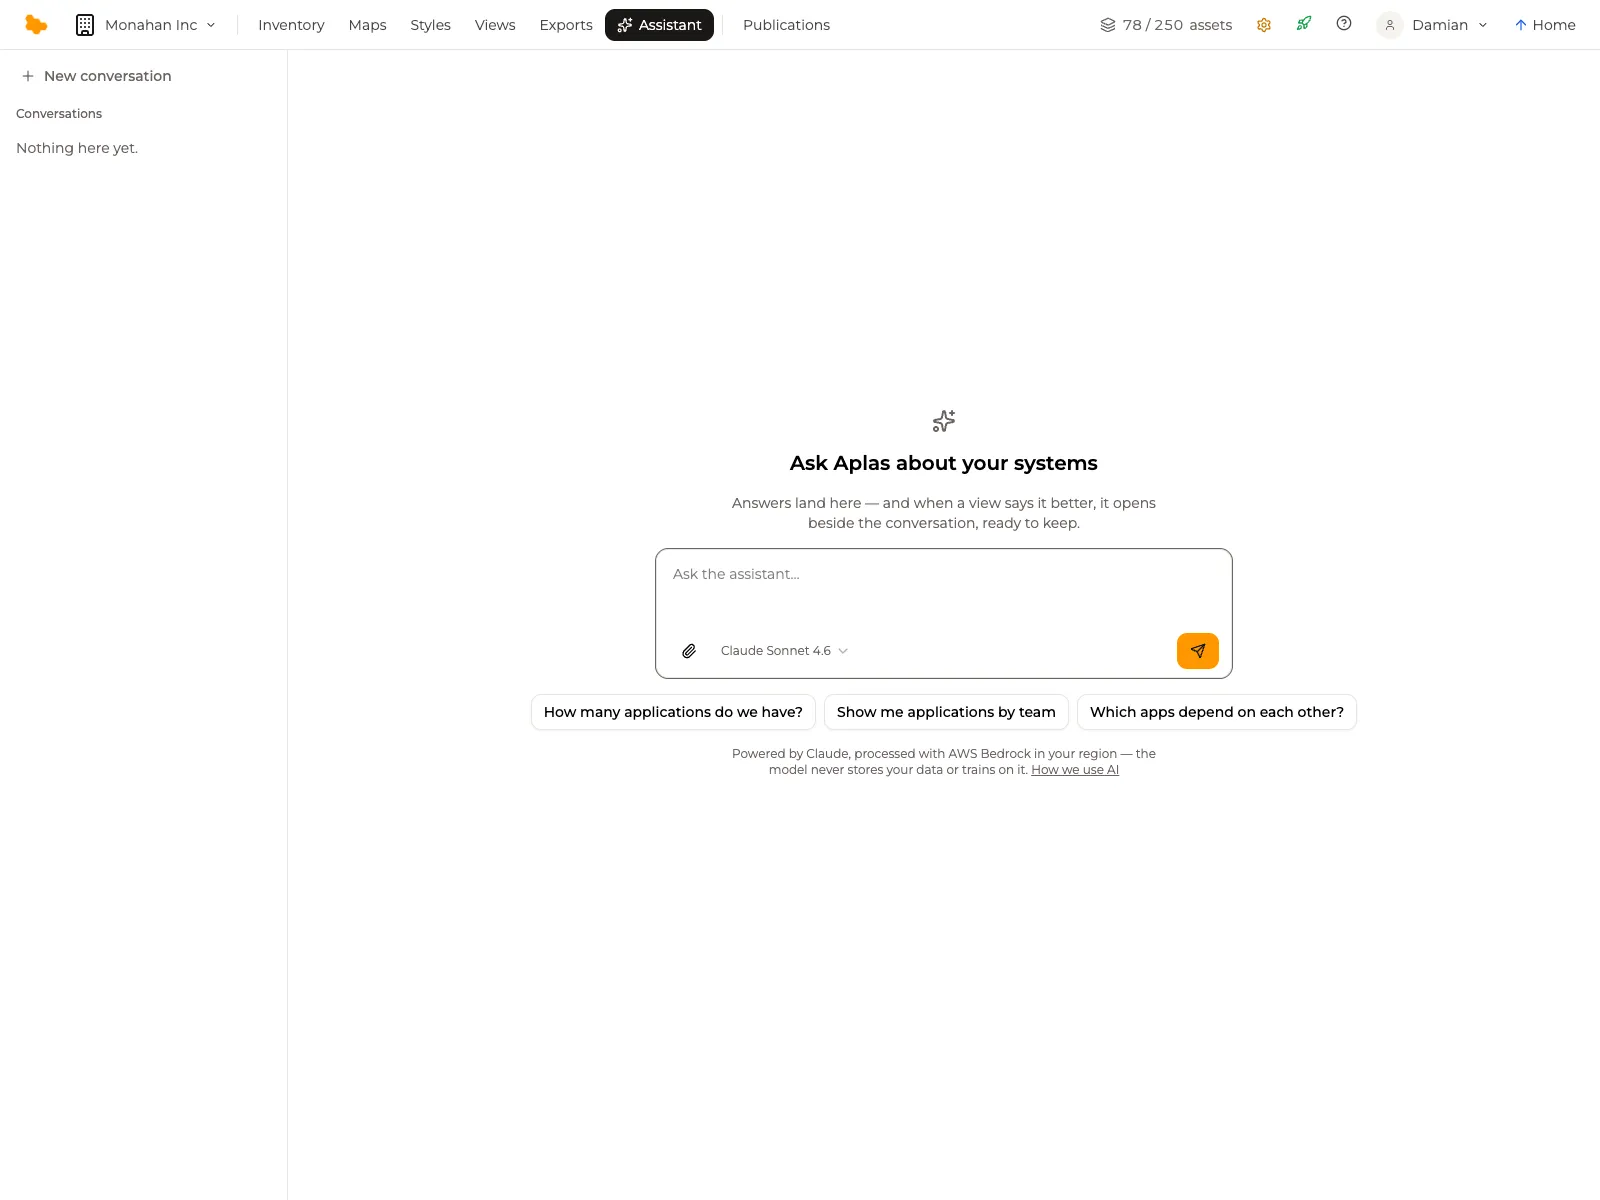
Ask the assistant a question about your systems and it answers from your inventory — as text, or as a view opened beside the conversation when that says it better. Ask it to build something and the change arrives as a proposal for you to keep or discard.
For the tools you already use, an API key opens the REST API and the MCP server, so an AI assistant in your editor can query and maintain the same inventory.