
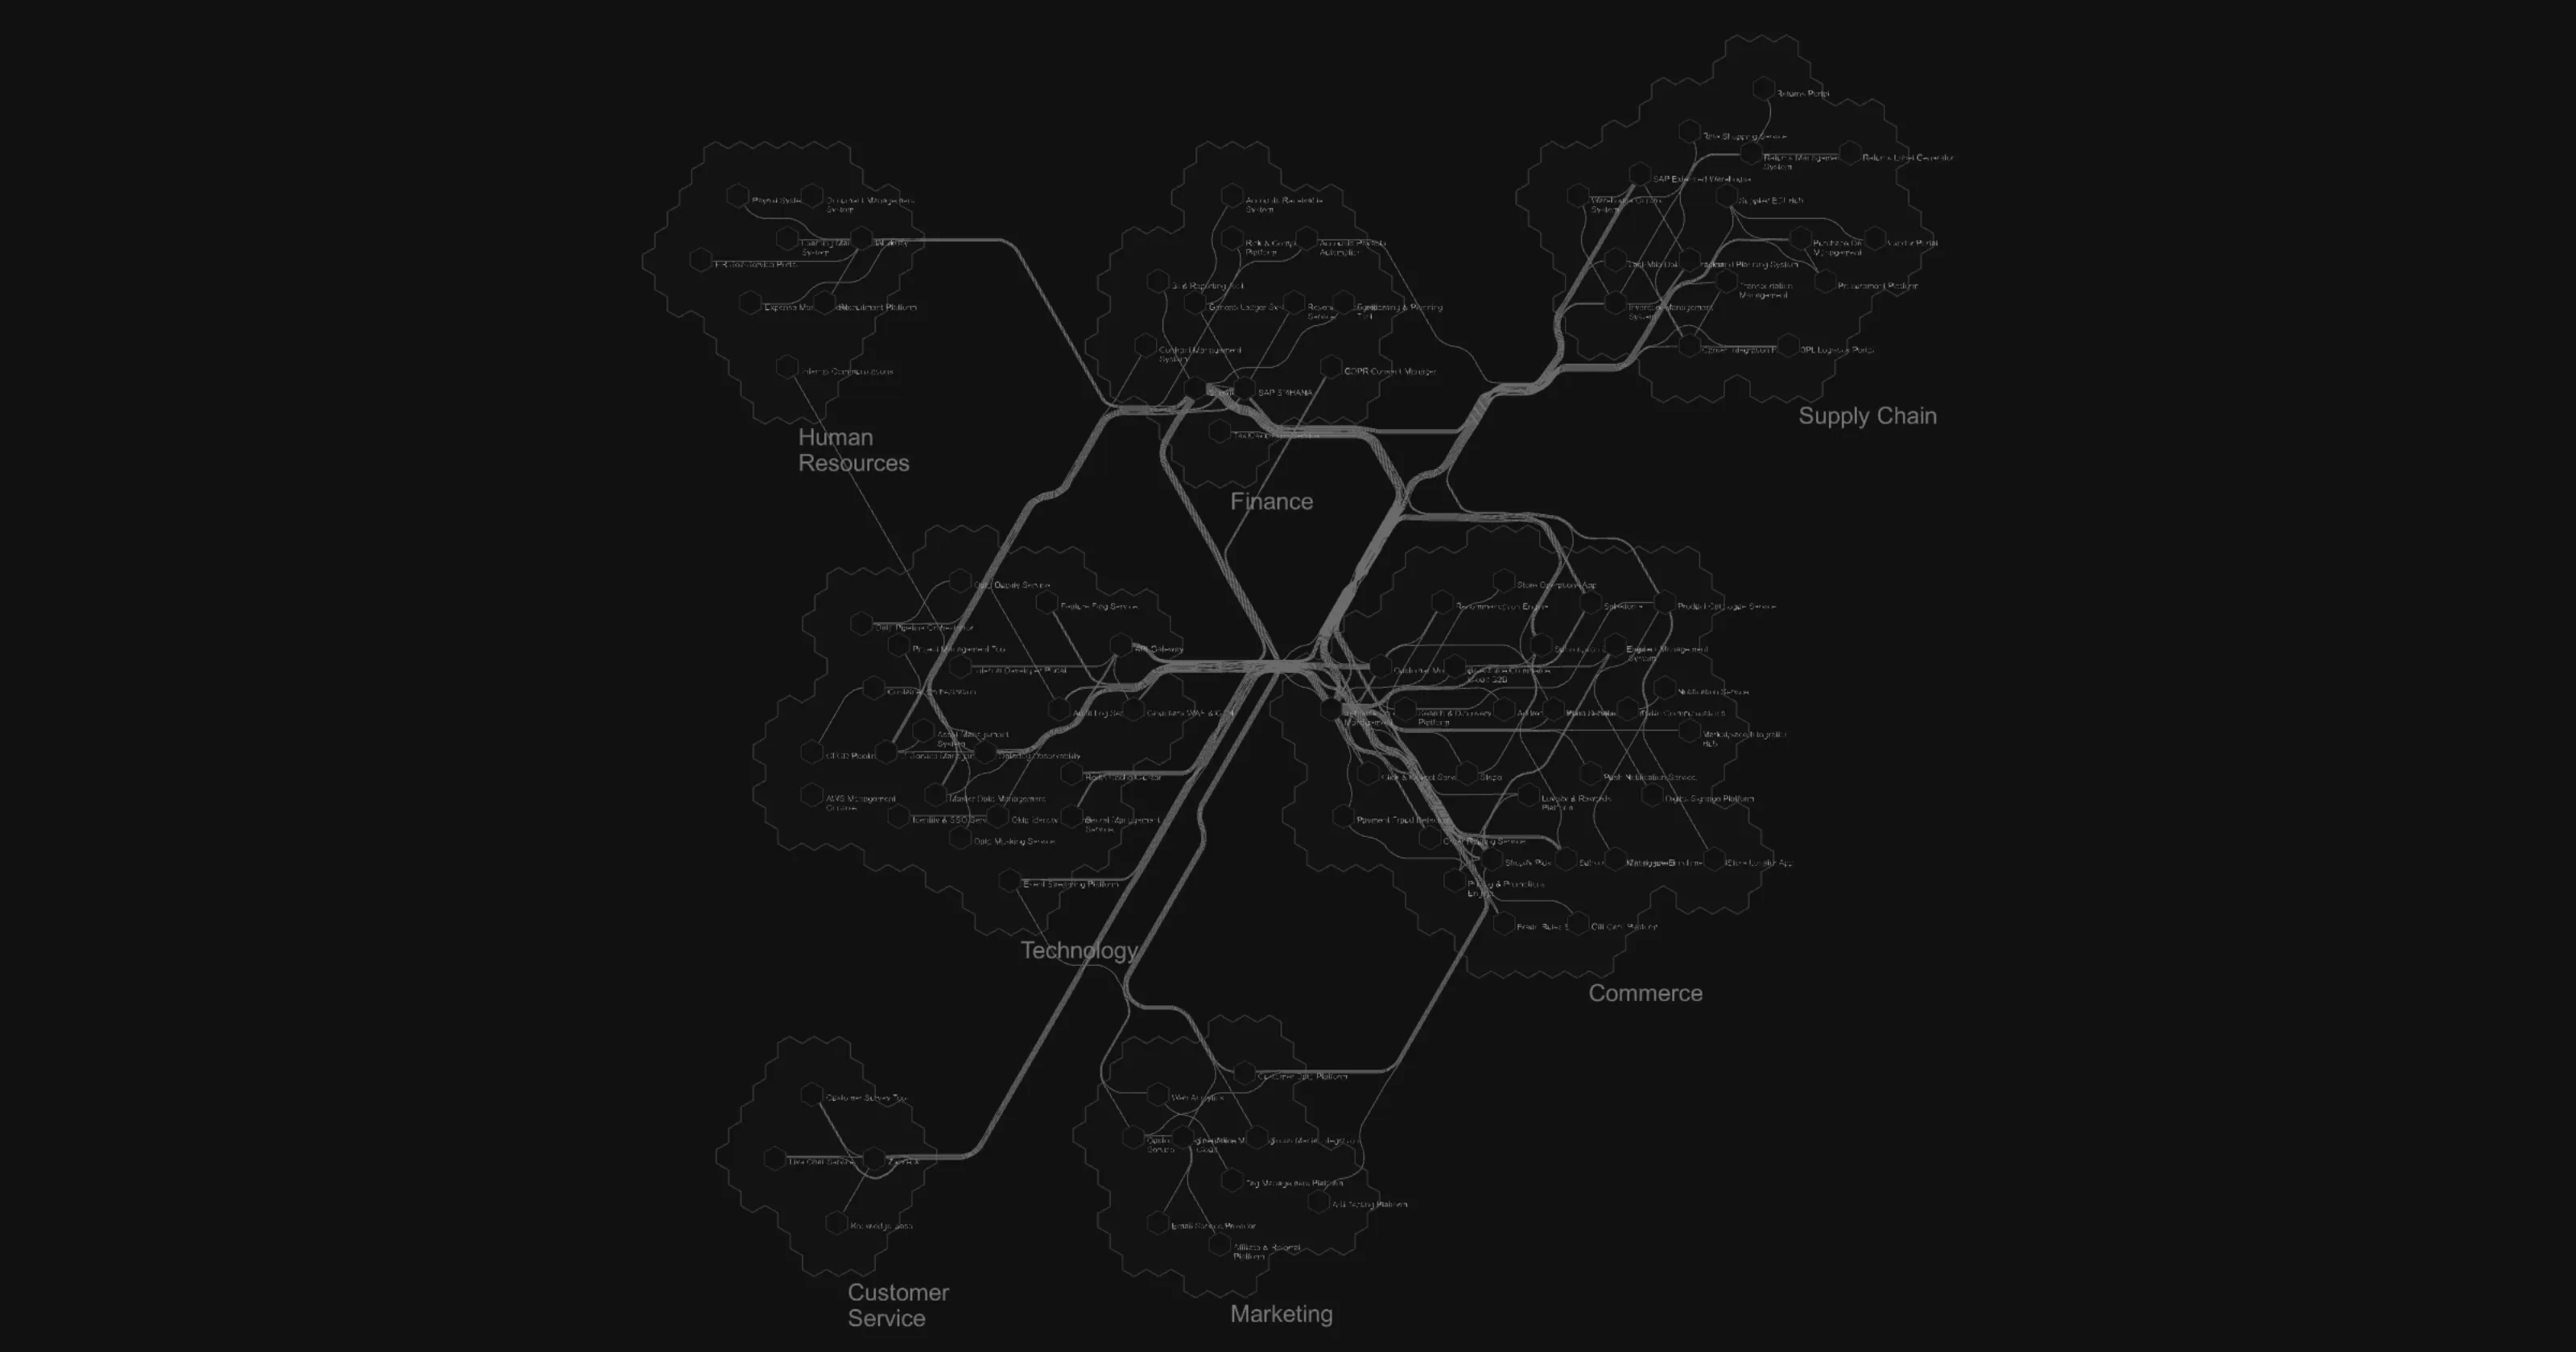
Aplas has a new foundation, and it answers the two things people told us most often after a trial: it was hard to get their data in, and hard to get what they needed out. Since 14 August, every new organization starts on a configurable inventory that models any landscape, an AI assistant that builds it from whatever you have, and five ways to view, publish and export it. We call the release “any data, any view” because that is the complaint, turned around.
What used to go wrong
Since 2017 Aplas modelled a landscape as four things: applications, integrations, components and collections. If your estate was applications and the integrations between them, it fit. If it was also business capabilities, teams, data stores, vendors, processes and projects — as most are — a lot of it had nowhere to go, or was flattened into a custom field or a tag on an application. Getting data in meant shaping it to our model first.
Getting it out was narrow too. The map was the point of Aplas, and it still is, but the map — and search over it — was most of what you could publish. If your CIO wanted a table, your PMO a matrix, or your auditor a spreadsheet, you built it somewhere else.
The obvious fix — a fully configurable model — comes with a well-known trap. Hand an architect a blank canvas and the first month goes on designing a schema instead of understanding an estate. So this release does both halves. The inventory is flexible underneath: asset types, fields and relations are yours to define. And it is opinionated on top: the AI proposes a model from your own data, and you confirm it. Nobody starts from a blank schema.
What you can get in
Anything, not just software. Define your own asset types, each with its own fields and relations — business capabilities, processes, APIs, data objects and stores, technologies, servers, locations, vendors, teams. A ready-made catalog of asset types, spanning business, applications and data, and technology and operations, gives a new workspace structure from the first minute; add to it or change it as you go. Relations are typed, and any asset type can relate to any other.
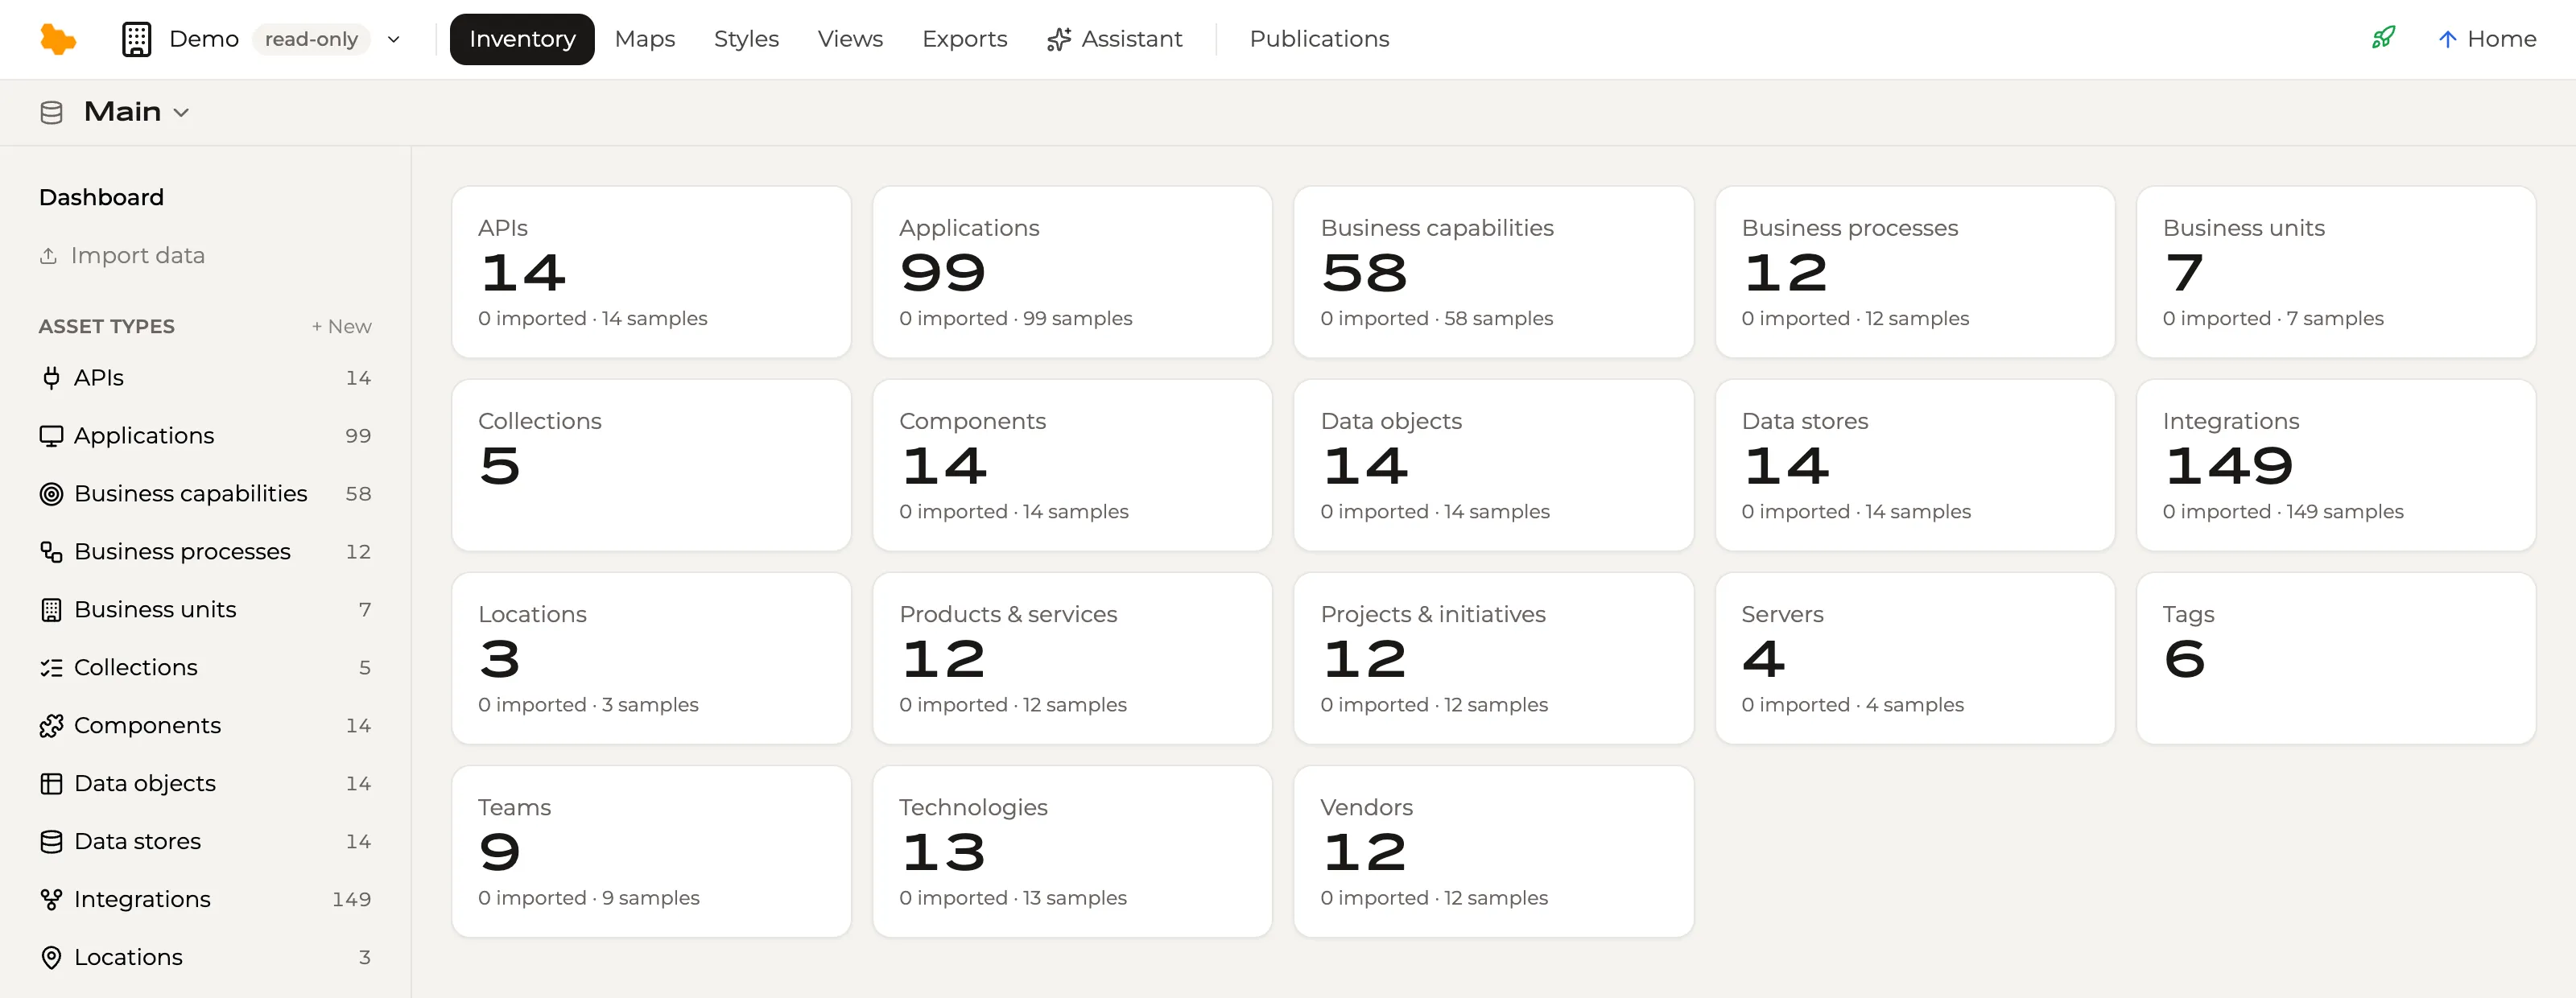 The demo workspace’s inventory: 18 asset types, each with its own fields and relations.
Your spreadsheet, as it is. Drop a CSV or an Excel workbook — several sheets are fine — or paste in what you have. The AI reads it and proposes asset types, fields, relations and the assets themselves; you check the proposal and confirm it, and the assets are created. No template to fill in first, no column-mapping screen.
Or just describe it. The in-app assistant builds the inventory in conversation. Every change it proposes arrives as a card, and nothing is written until you confirm it. Ask a question in plain language and the answer comes back as text — or, when a view says it better, as a table or graph opened beside the conversation. It runs on Claude, processed with AWS Bedrock in your organization’s region, and you choose the model for each conversation; the model never stores your data or trains on it.
A grid built for real work. Once the data is in: sortable columns, typed filters, a facet rail, bulk edits, and workspaces to organize the estate — a production inventory and a staging copy, or one per division — with a recent-changes feed that names who changed what.
What you can get out
Five views of one inventory. The same assets render as a map, a table, a matrix, a graph or a search. Views gathers every way of looking at the inventory, and a saved set of filters and columns is itself a view. The map is still the signature: assets pinned to a grid so the same thing is always in the same place, built from the inventory, and styled for each audience — a map can carry several styles, each telling a different story.
Publish any of them. Every view carries its own publish card. A publication opens to your organization’s members — narrowed to named people where you want it narrower — and Publications lists what is live across the whole organization. Published views work on phones.
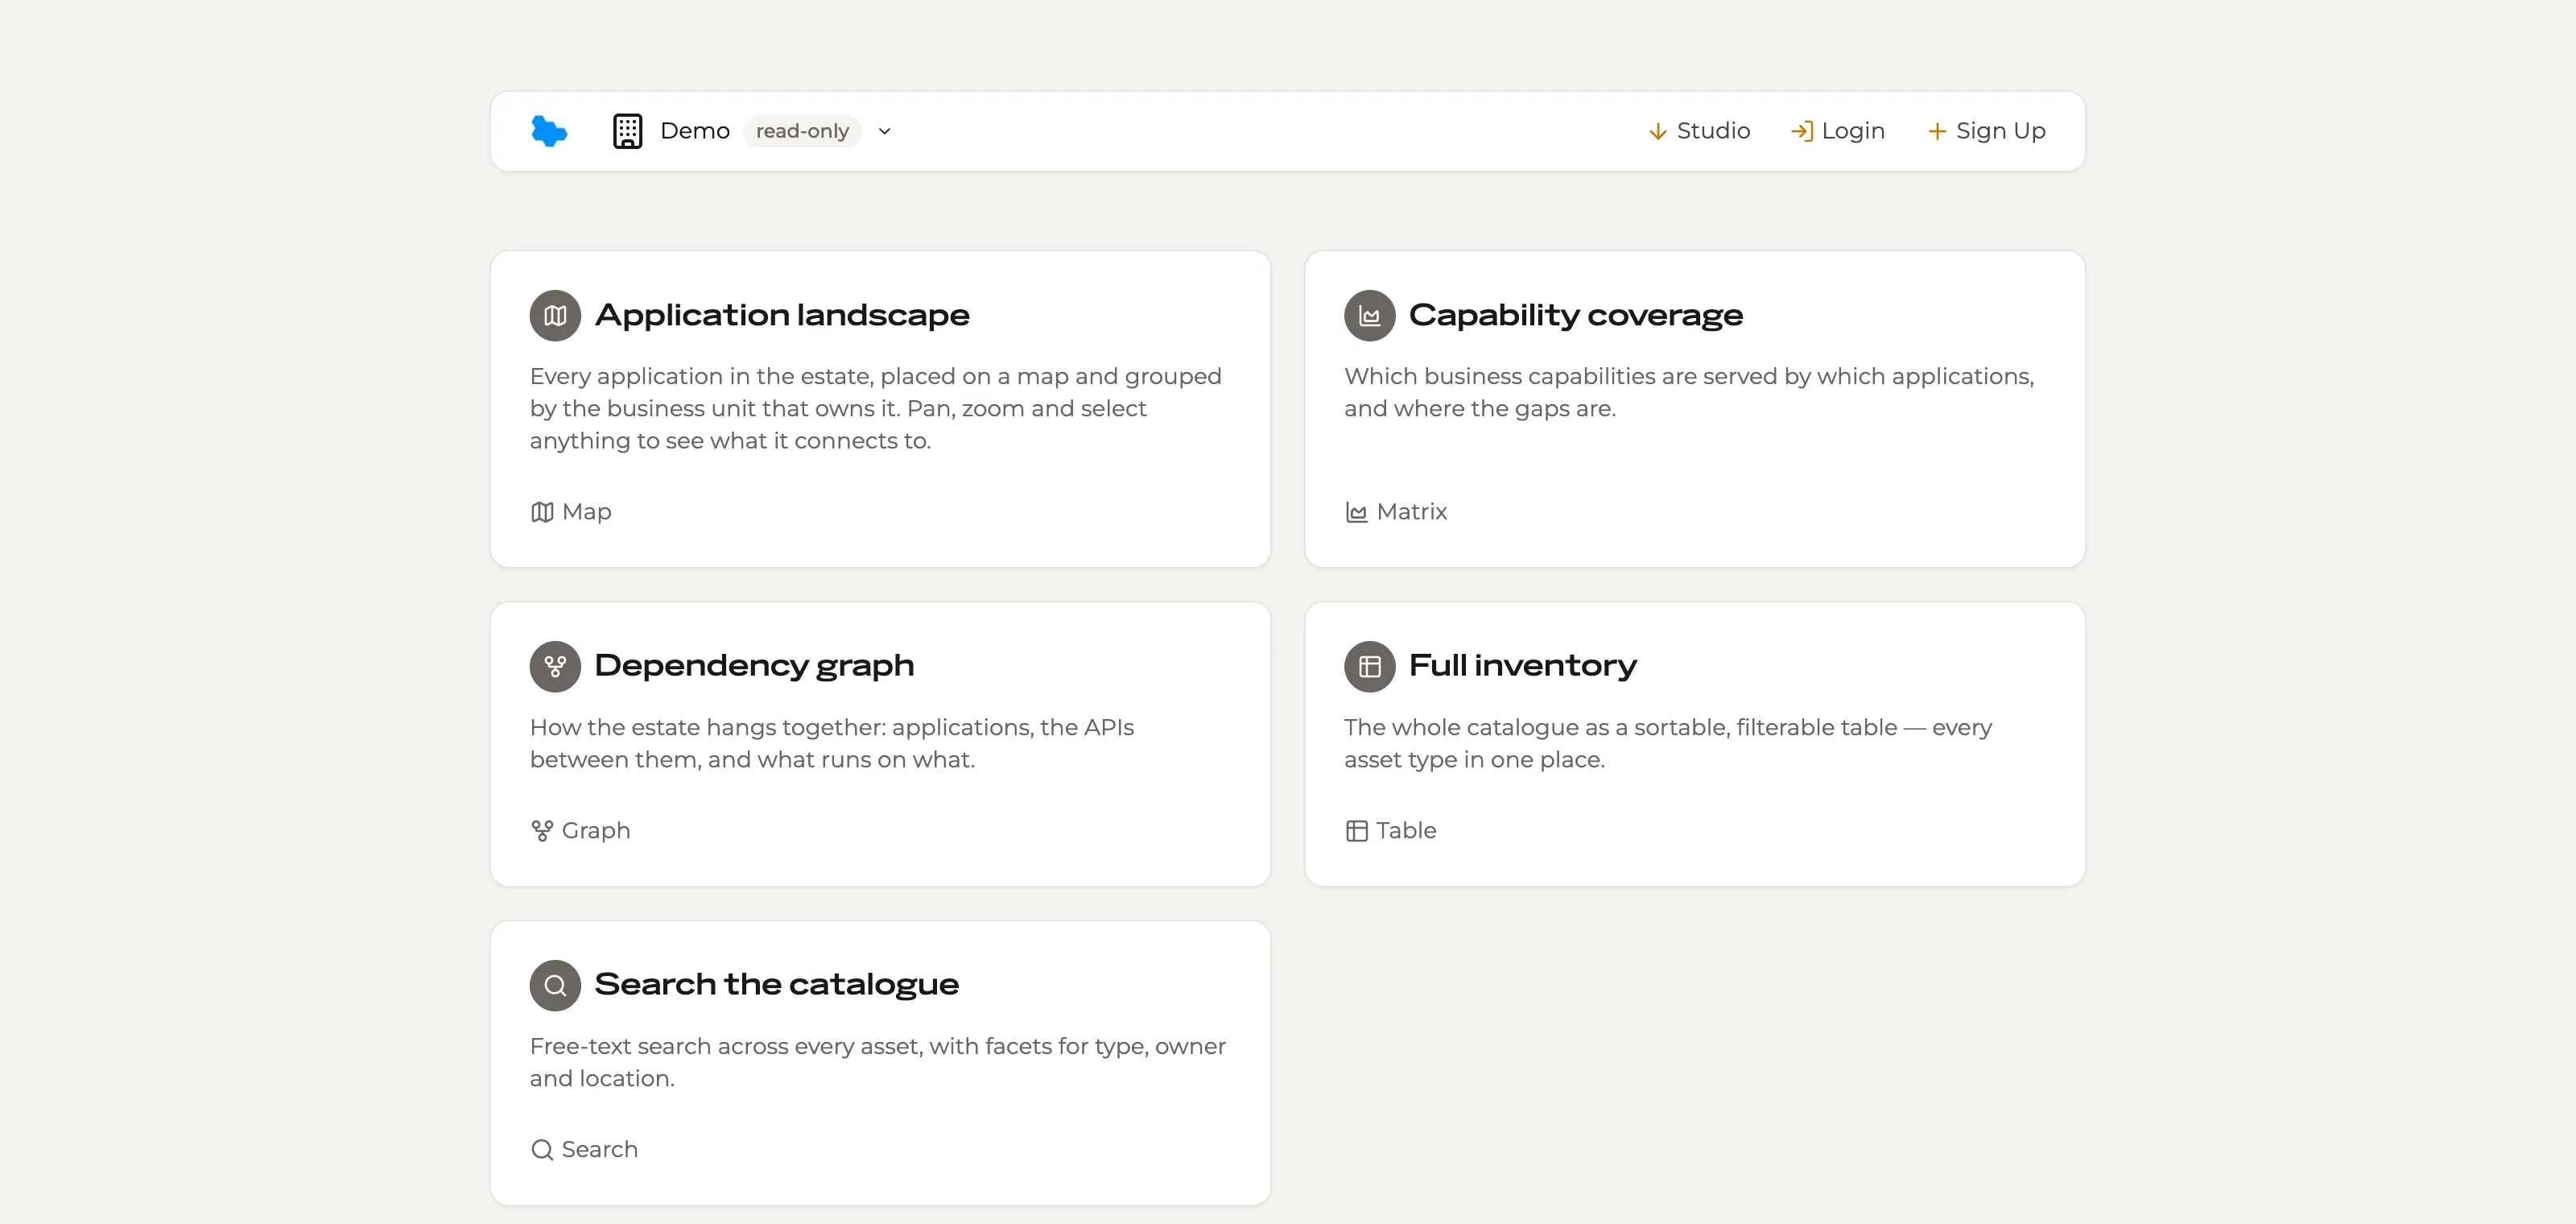 Five published views of the same inventory, as the demo organization’s readers see them.
Take it with you. Any table view exports to Excel exactly as shown — rows, columns, filters and sort. Generate a State of the Estate PDF of the whole inventory. Export a map as a PNG. An organization-wide ledger records every file generated or downloaded.
Your first session back
- Set up your workspace. Two questions — your industry, and roughly how many applications you run — then choose what you want to catalogue from a pre-filled list.
- Bring what you have. The spreadsheet that didn’t fit last time is the right test. Or, with nothing to hand, have Aplas draft sample assets for your industry to correct.
- Review the proposal. The AI’s reading of your data — asset types, fields, relations and the assets themselves — is laid out for you to check. Confirm it and the assets are created.
- Open the map. Or the table, or the graph, or ask the assistant. Publish whichever view answers the question you get asked most.
The aim is that the session ends with your own estate on a map, not with a schema. Sample assets are badged, cleared in one action, and left out of the State of the Estate PDF and full workspace exports — and editing one makes it yours.
Pricing changed too
Plans are sized by the number of assets you manage, not the number of people who use Aplas — everyone who builds a view and everyone who reads a publication is included on every plan. Free covers inventories up to 50 assets, no card required. Standard is $195 a month for up to 250 assets, Premium is $495 a month for up to 600, and Enterprise is priced from $1,000 a month with negotiated limits; annual billing gives two months free. Paid plans start with a 30-day trial. Copies of an asset — a staging workspace, a clone to test a change — count once. Enterprise SSO is included on every paid tier, and every organization chooses its data region — Australia, Europe or the United States — when it is created. The pricing page has the full comparison.
Existing customers
If your organization was created before 14 August, nothing changes today. You keep your current workspace, features and pricing. We’re moving existing organizations to the new inventory one at a time, and we’ll be in touch to plan yours.
See it, then bring your data
The demo workspace is a full working inventory — 18 asset types, five published views — that you can explore without signing up. When you’re ready, start a new organization on Free or begin a Standard trial and bring the spreadsheet. The getting started guide covers the inventory, views, publishing, workspaces, exports and the assistant.
Subscribe to our software stories newsletter to ensure you never miss a post!